SLURM Dashboard
Overview
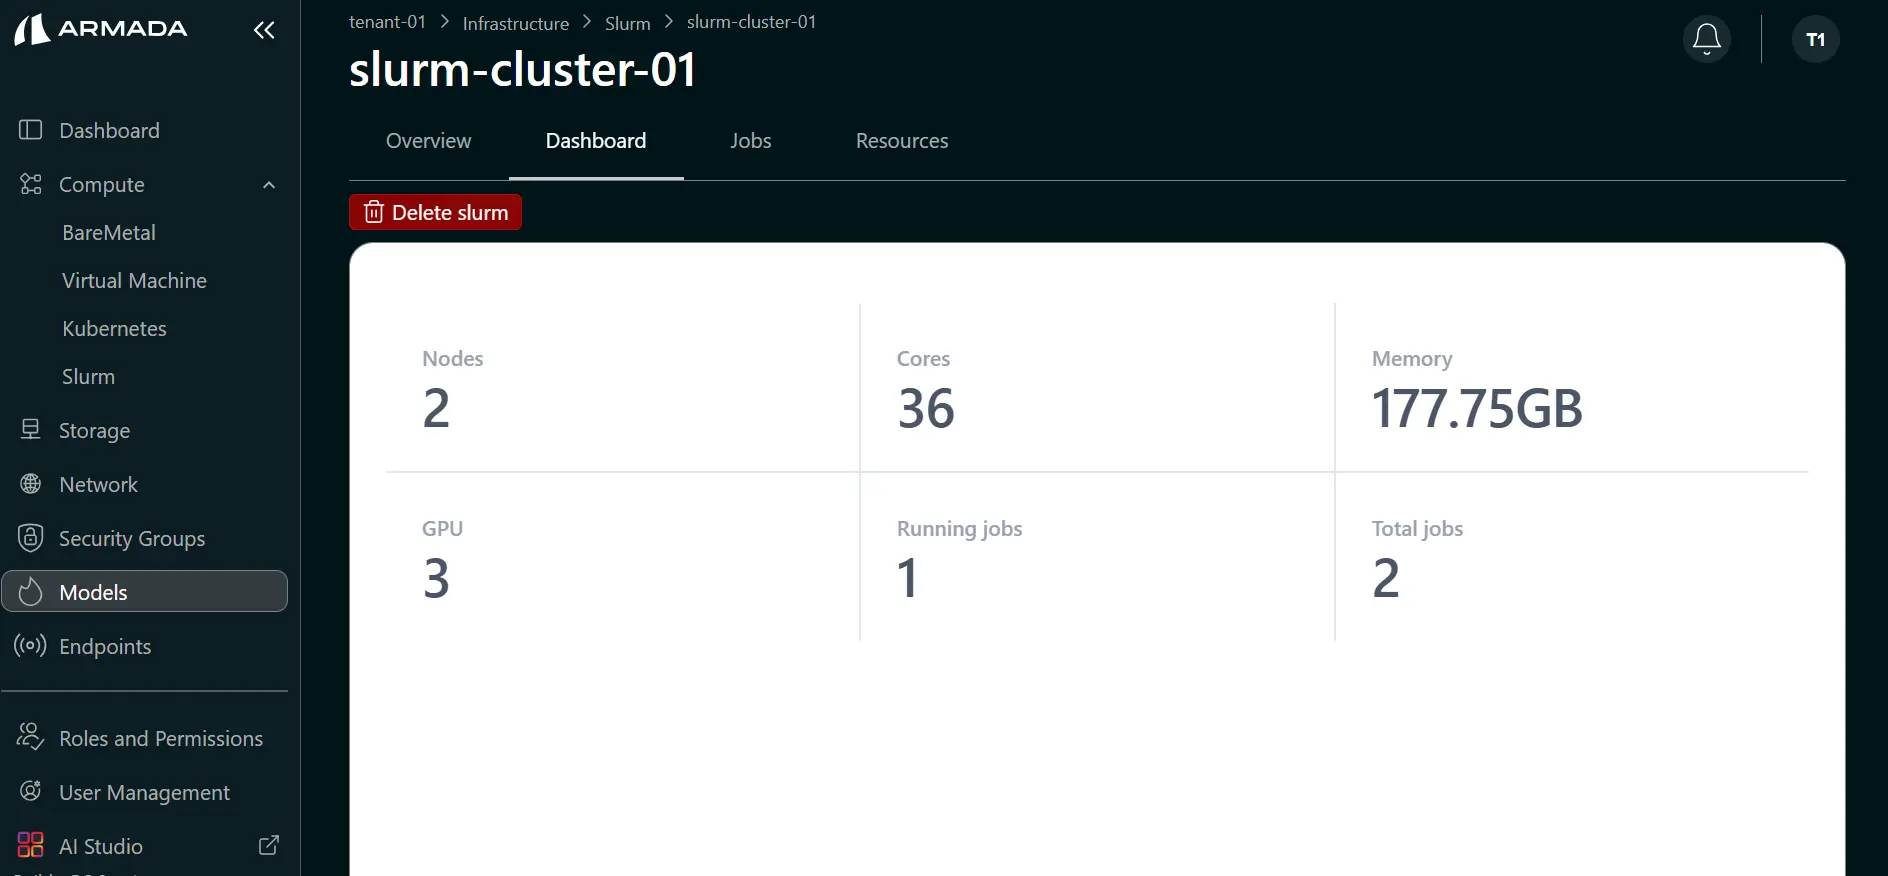
Once the Slurm cluster is created, you can open the dashboard to see an overview of nodes, cores, memory, GPU, running jobs, and total jobs.
- Cluster Status - Overall health and status
- Node Information - Status of individual nodes
- Job Queue - Pending and running jobs
- Resource Utilization - CPU, memory, GPU usage
- Performance Metrics - Real-time performance data
Prerequisites
- Tenant Admin access
- A SLURM cluster in Running state
Step 1: Open Dashboard
- From the Slurm cluster view, click Dashboard.