Observability with Splunk
Bridge integrates with Splunk as a third-party observability platform, bridging the gap between infrastructure management and deep-tier analytics. This integration allows you to seamlessly stream system logs, performance metrics, and security events directly from Bridge components to your Splunk environment.
By eliminating the need for complex manual middleware, this integration provides real-time visibility into your PaaS and DevOps workflows — enabling faster troubleshooting and data-driven decision-making through your existing Splunk dashboards.
Configuring a Sample Dashboard
If you have not configured any dashboard in Splunk, you can use the sample payload.xml content below to set up a sample dashboard. This dashboard displays logs from one of the Bridge components (Orchestrator). Once configured, you can filter logs by tenant using the Tenants dropdown and adjust the time range to narrow down log entries.
Prerequisites
- Access to your Splunk instance with admin credentials.
- Create a
payload.xmlfile with the following content to configure the dashboard:
payload.xml
<dashboard version="2" theme="light"><label>Admin Dashboard</label><description></description><definition><![CDATA[{
  "title": "Admin Dashboard",
  "description": "",
  "inputs": {
    "input_global_trp": {
      "options": {
        "defaultValue": "-24h@h,now",
        "token": "global_time"
      },
      "title": "Global Time Range",
      "type": "input.timerange"
    },
    "input_uxXLaQZD": {
      "context": {
        "formattedConfig": {
          "number": {
            "prefix": ""
          }
        },
        "formattedStatics": ">statics | formatByType(formattedConfig)",
        "label": ">primary | seriesByName(\"Name\") | renameSeries(\"label\") | formatByType(formattedConfig)",
        "statics": [],
        "value": ">primary | seriesByName(\"Tenant ID\") | renameSeries(\"value\") | formatByType(formattedConfig)"
      },
      "dataSources": {
        "primary": "ds_nPO17pSu"
      },
      "options": {
        "items": ">frame(label, value) | prepend(formattedStatics) | objects()",
        "selectFirstSearchResult": true,
        "token": "tenant_id"
      },
      "title": "Tenants",
      "type": "input.dropdown"
    }
  },
  "defaults": {
    "dataSources": {
      "ds.search": {
        "options": {
          "queryParameters": {
            "earliest": "$global_time.earliest$",
            "latest": "$global_time.latest$"
          }
        }
      },
      "ds.spl2": {
        "options": {
          "queryParameters": {
            "earliest": "$global_time.earliest$",
            "latest": "$global_time.latest$"
          }
        }
      }
    },
    "visualizations": {
      "global": {
        "showProgressBar": true
      }
    }
  },
  "visualizations": {
    "viz_oRFNz494": {
      "dataSources": {
        "primary": "ds_tpnX7dzJ"
      },
      "options": {},
      "type": "splunk.events"
    },
    "viz_rz31EneX": {
      "dataSources": {
        "primary": "ds_F9R1Hwg9"
      },
      "options": {
        "count": 20,
        "dataOverlayMode": "none",
        "drilldown": "none",
        "showInternalFields": false,
        "showRowNumbers": false
      },
      "type": "splunk.table"
    }
  },
  "dataSources": {
    "ds_F9R1Hwg9": {
      "name": "Event_search",
      "options": {
        "query": "index=\"main\" source=\"/var/log/containers/auth-gateway-*\"\r\n\"TenantsService\" (\"bootstrap\" OR \"teardown\")\r\n| rex field=_raw \"tenantId=(?P<tenantId>[a-f0-9\\-]{36})\"\r\n| rex field=_raw \"(?P<event_raw>bootstrap|teardown)\"\r\n| rex field=_raw \"(?P<phase>start|done)\"\r\n| eval event_type=case(\r\n    event_raw=\"bootstrap\" AND phase=\"done\", \"TENANT_CREATED\",\r\n    event_raw=\"teardown\" AND phase=\"start\", \"TENANT_DELETED\",\r\n    true(), \"UNKNOWN\"\r\n  )\r\n| where event_type!=\"UNKNOWN\"\r\n| eval severity=\"INFO\"\r\n| eval timestamp=strftime(_time, \"%Y-%m-%d %H:%M:%S\")\r\n| join type=left tenantId [\r\n  search index=\"main\" source=\"/var/log/containers/auth-gateway-*\"\r\n  \"TenantsService\" \"bootstrap\" \"start\"\r\n  | rex field=_raw \"tenantId=(?P<tenantId>[a-f0-9\\-]{36})\\s+name=(?P<name>[^\\x1b\\s]+)\"\r\n  | rex field=name mode=sed \"s/\\[[0-9;]*m//g\"\r\n  | stats latest(name) as name by tenantId\r\n]\r\n| table timestamp, event_type, severity, tenantId, name\r\n| sort -timestamp",
        "queryParameters": {
          "earliest": "$global_time.earliest$",
          "latest": "$global_time.latest$",
          "sampleRatio": 1
        }
      },
      "type": "ds.search"
    },
    "ds_nPO17pSu": {
      "name": "tenant_search",
      "options": {
        "query": "index=\"main\" source=\"/var/log/containers/auth-gateway-*\"\r\n\"TenantsService\" \"bootstrap\" \"start\"\r\n| rex field=_raw \"tenantId=(?P<tenantId>[a-f0-9\\-]{36})\\s+name=(?P<name>[^\\x1b\\s]+)\"\r\n| eval status=\"active\"\r\n| table tenantId, name, status\r\n| append [\r\n  search index=\"bridge_logs\" source=\"/var/log/containers/auth-gateway-*\"\r\n  \"TenantsService\" \"teardown\" \"start\"\r\n  | rex field=_raw \"tenantId=(?P<tenantId>[a-f0-9\\-]{36})\"\r\n  | eval status=\"inactive\"\r\n  | table tenantId, status\r\n]\r\n| stats values(name) as name values(status) as status by tenantId\r\n| eval name=mvindex(name, 0)\r\n| eval status=if(mvcount(status)>1, \"inactive\", status)\r\n| eval name=name.\"(\".status.\")\"\r\n| rename tenantId as \"Tenant ID\" name as \"Name\"\r\n| table \"Tenant ID\", \"Name\"\r\n| sort \"Name\"",
        "queryParameters": {
          "earliest": "$global_time.earliest$",
          "latest": "$global_time.latest$"
        }
      },
      "type": "ds.search"
    },
    "ds_tpnX7dzJ": {
      "name": "logs_search",
      "options": {
        "query": "index=\"main\" source=\"/var/log/containers/orch*\" \"/tenants/\"$tenant_id$\"/*\"",
        "queryParameters": {
          "earliest": "$global_time.earliest$",
          "latest": "$global_time.latest$"
        }
      },
      "type": "ds.search"
    }
  },
  "layout": {
    "globalInputs": [
      "input_global_trp",
      "input_uxXLaQZD"
    ],
    "layoutDefinitions": {
      "layout_1": {
        "options": {
          "height": 960,
          "width": 1440
        },
        "structure": [
          {
            "item": "viz_oRFNz494",
            "position": {
              "h": 400,
              "w": 1440,
              "x": 0,
              "y": 0
            },
            "type": "block"
          }
        ],
        "type": "grid"
      },
      "layout_3tDUOT4X": {
        "structure": [
          {
            "item": "viz_rz31EneX",
            "position": {
              "h": 300,
              "w": 1200,
              "x": 0,
              "y": 0
            },
            "type": "block"
          }
        ],
        "type": "grid"
      }
    },
    "options": {},
    "tabs": {
      "items": [
        {
          "label": "Logs",
          "layoutId": "layout_1"
        },
        {
          "label": "Events",
          "layoutId": "layout_3tDUOT4X"
        }
      ]
    }
  },
  "applicationProperties": {}
}
]]></definition></dashboard>
Steps to Add Dashboard in Splunk Server
-
Execute the following command on your Splunk server to create the sample dashboard:
curl -k -u <SPLUNK_USERNAME>:<SPLUNK_PASSWORD> \
  -X POST https://localhost:8089/servicesNS/<SPLUNK_USERNAME>/search/data/ui/views \
  --data-urlencode "name=Admin_Dashboard" \
  --data-urlencode "eai:data@payload.xml"
Replace the following placeholders:
<SPLUNK_USERNAME>— Your Splunk admin username<SPLUNK_PASSWORD>— Your Splunk admin password
-
Verify that the command returns a successful response from the Splunk REST API.
Accessing the Dashboard
- Log in to Bridge as a Super Admin.
- In the sidebar, click Observability.
If the Observability option is not visible in the sidebar, contact the Bridge support team at support@armada.ai.
- Click Dashboard.
- The configured dashboard (Admin Dashboard) is displayed with logs and events from Bridge components.
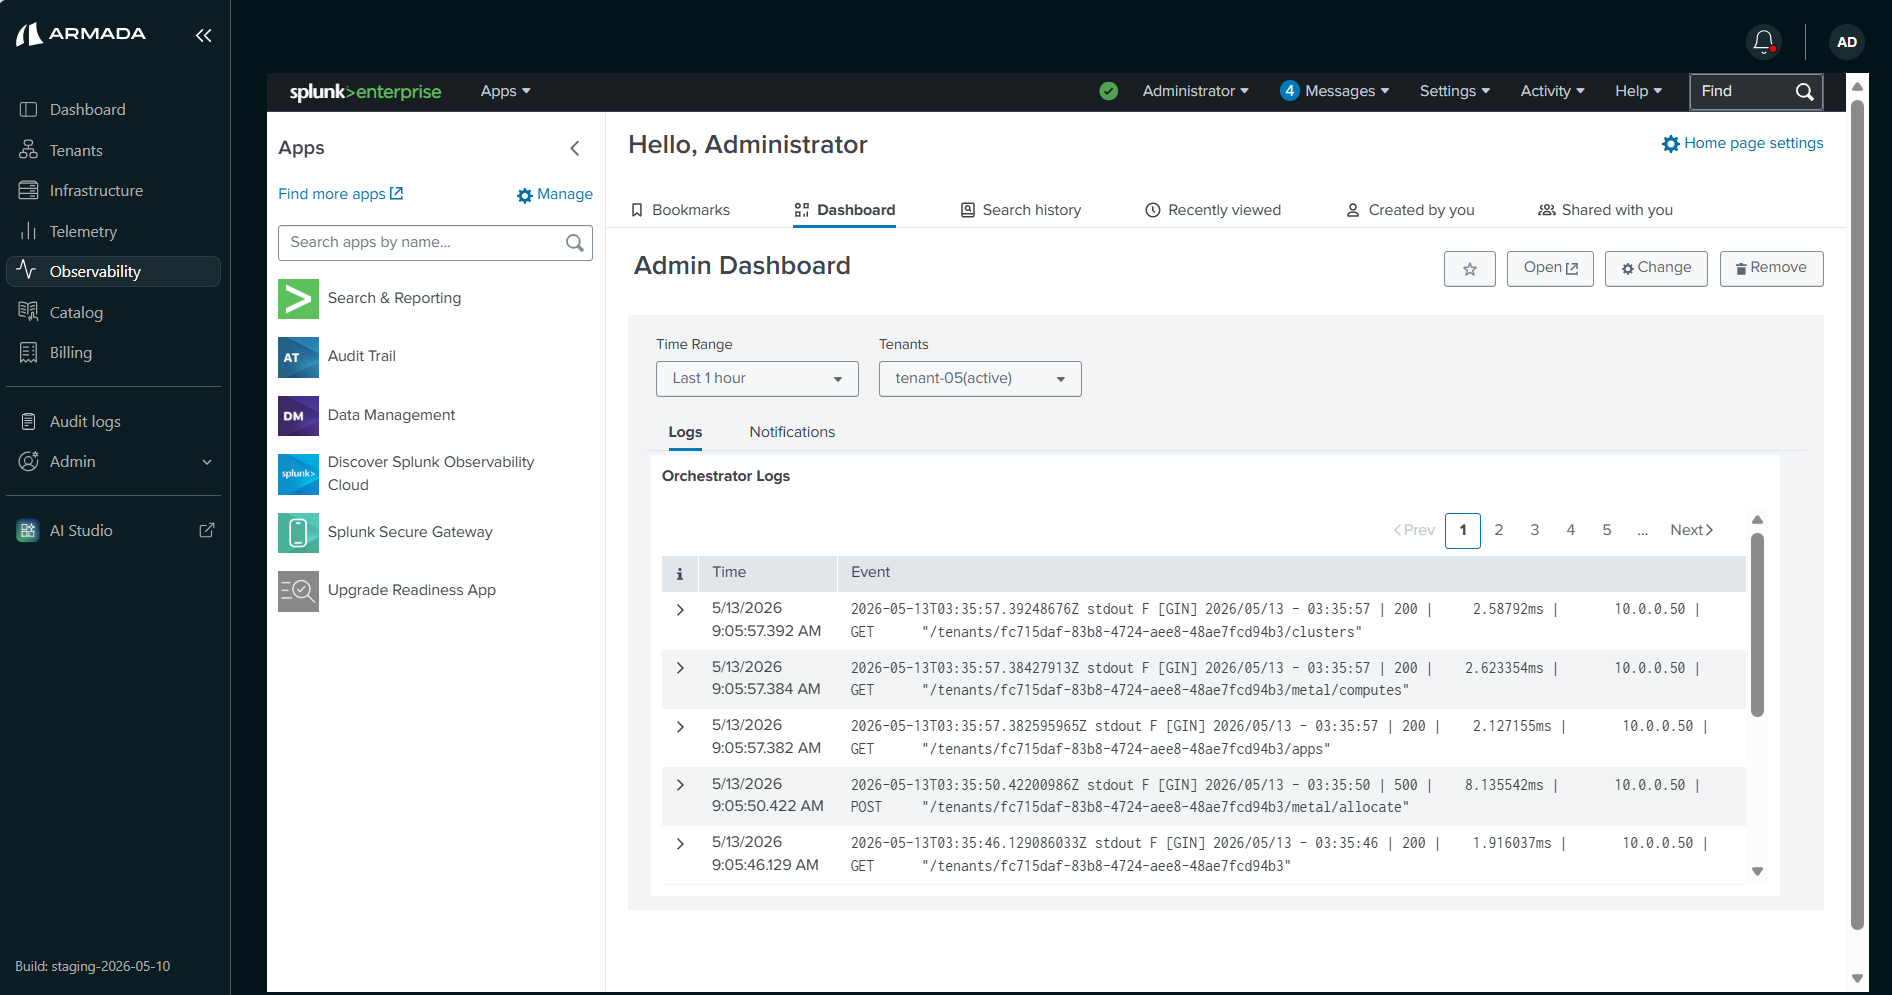
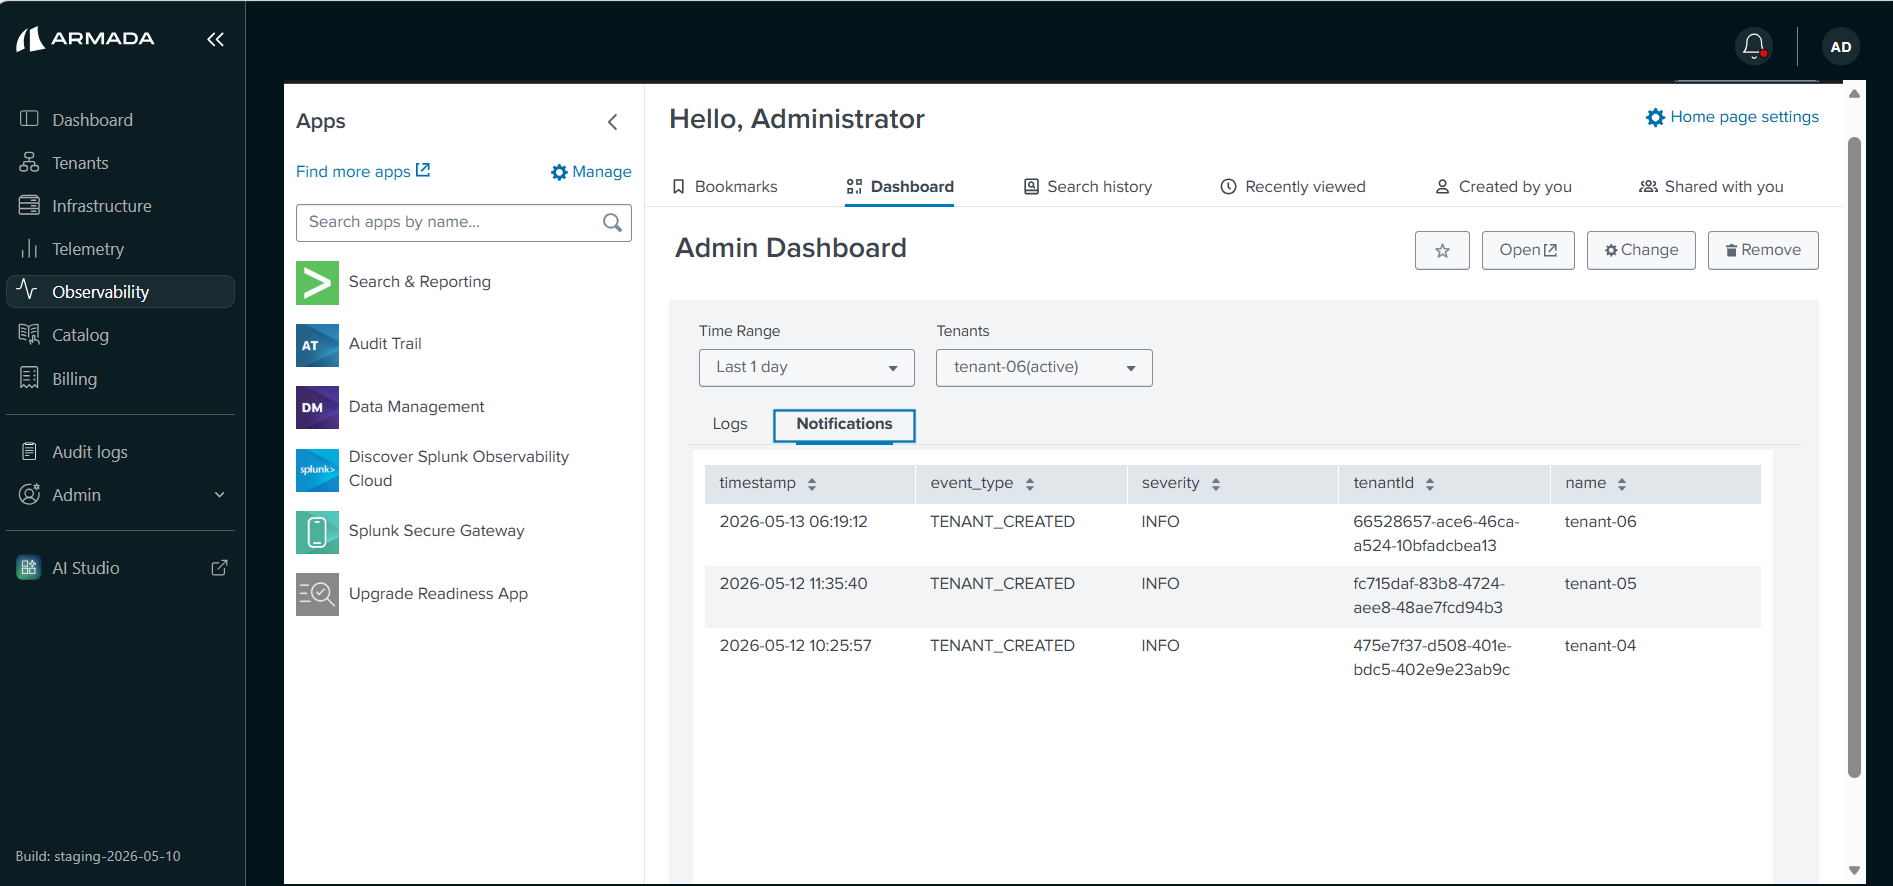
Using the Dashboard
Filtering by Tenant
Select a specific tenant from the Tenants dropdown at the top of the dashboard to view logs scoped to that tenant.
Filtering by Time Range
Use the Time Range dropdown to select a predefined time window (e.g., Last 1 hour, Last 24 hours) and view logs within that period.
Log Details
Each log entry in the dashboard includes:
| Field | Description |
|---|---|
| Time | The date and time when the event occurred |
| Event | Detailed event information including the HTTP method, endpoint path, response status code, source IP, and response time |
Click the expand arrow (>) on any log entry to view the full event details.
Splunk Apps
The Observability integration also provides access to additional Splunk apps from the left panel:
| App | Description |
|---|---|
| Search & Reporting | Run custom SPL queries against collected log data |
| Audit Trail | View audit trail events within Splunk |
| Data Management | Manage data inputs, indexes, and data pipelines |
| Discover Splunk Observability Cloud | Access Splunk's cloud-based observability features |
| Splunk Secure Gateway | Manage secure gateway configurations for data forwarding |
| Upgrade Readiness App | Check Splunk upgrade compatibility and readiness |
Next Steps
- Tenant Creation — Create isolated tenant environments with resource quotas and pricing configuration.
- Create a Tenant Admin user — Create a Tenant Admin account so the tenant can begin operations.