LLM Monitoring & Observability
Overview
LLM Monitoring and Observability provide insights into how Large Language Models (LLMs) behave in production. It helps track performance, reliability, and cost of responses generated by LLM-powered applications.
Once a model is shared with tenant users and they begin using it, the Tenant Admin can monitor performance metrics from the model view page.
Performance Metric
Bridge tracks the following performance metrics for deployed LLM models:
TTFT (Time To First Token)
Time To First Token (TTFT) measures the latency between when a request is sent to the model and when the first output token is generated. This metric reflects how quickly the model begins responding. High TTFT usually indicates delays in request queuing, prompt processing (prefill), or model initialization.
TPOT (Time Per Output Token)
Time Per Output Token (TPOT) measures the average time required to generate each output token during the decoding phase. It reflects the generation speed of the model. Lower TPOT indicates faster token generation and higher inference efficiency.
Input Token Rate
Input Token Rate measures the number of input tokens processed per second by the model. This metric represents the throughput of the prompt processing (prefill) stage, and is useful for evaluating how efficiently the system handles large prompts.
Output Token Rate
Output Token Rate measures the number of output tokens generated per second during inference. It indicates the generation throughput of the model and helps evaluate how quickly responses are produced for user requests.
KV Cache Utilization
KV Cache Utilization represents the percentage of the key-value attention cache currently being used by the model. Efficient KV cache usage improves inference performance by avoiding recomputation of attention states for previously processed tokens.
Prefix Cache Hit Rate
Prefix Cache Hit Rate measures how often incoming prompts match previously cached prefixes that can be reused. A higher hit rate reduces prompt processing latency and compute cost, since the model can reuse cached computations instead of recomputing them.
End-to-End (E2E) Latency
End-to-End Latency measures the total time taken to process a request, from when it is received until the complete response is returned. This includes queuing time, prompt processing, token generation, and response delivery.
Request Prefill Time
Prefill Time measures the time required for the model to process the input prompt and compute attention states before token generation begins. Long prefill times are typically caused by large input prompts or high system load.
Request Decode Time
Decode Time measures the time spent generating output tokens after the prefill stage. This metric reflects the performance of the token generation (decoding) phase of the model.
Prerequisites
- Tenant Admin access — You must log in as a Tenant Admin to view model monitoring and observability.
- Deployed model — A model must be deployed by a Tenant Admin. See Deploy Hugging Face Model, Deploy NIM Model, or Deploy Azure ML Model for details.
- Model in use — Tenant users must be actively using the deployed model. See Access Model Playground for details.
Accessing the LLM Monitoring Dashboard
Step 1: Open AI Studio
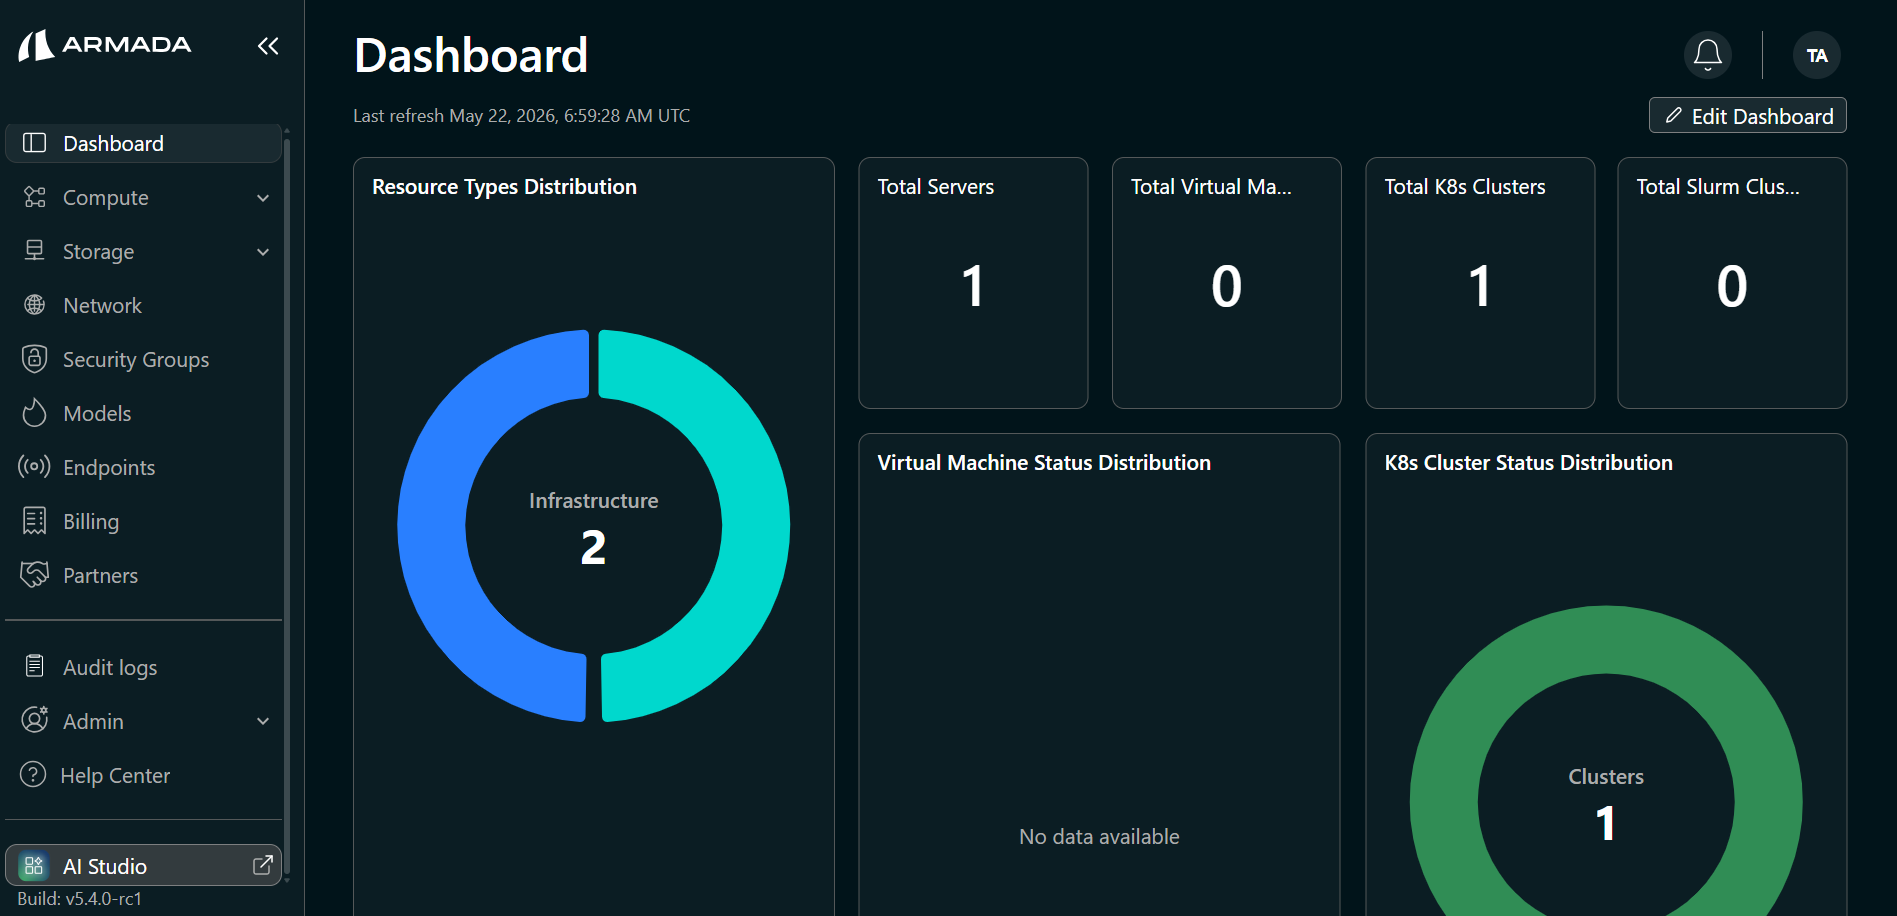
- Log in to Bridge as a Tenant Admin.
- In the left sidebar, click AI Studio. This opens a new tab.
- In the new tab, click Models.
Step 2: View Model Details
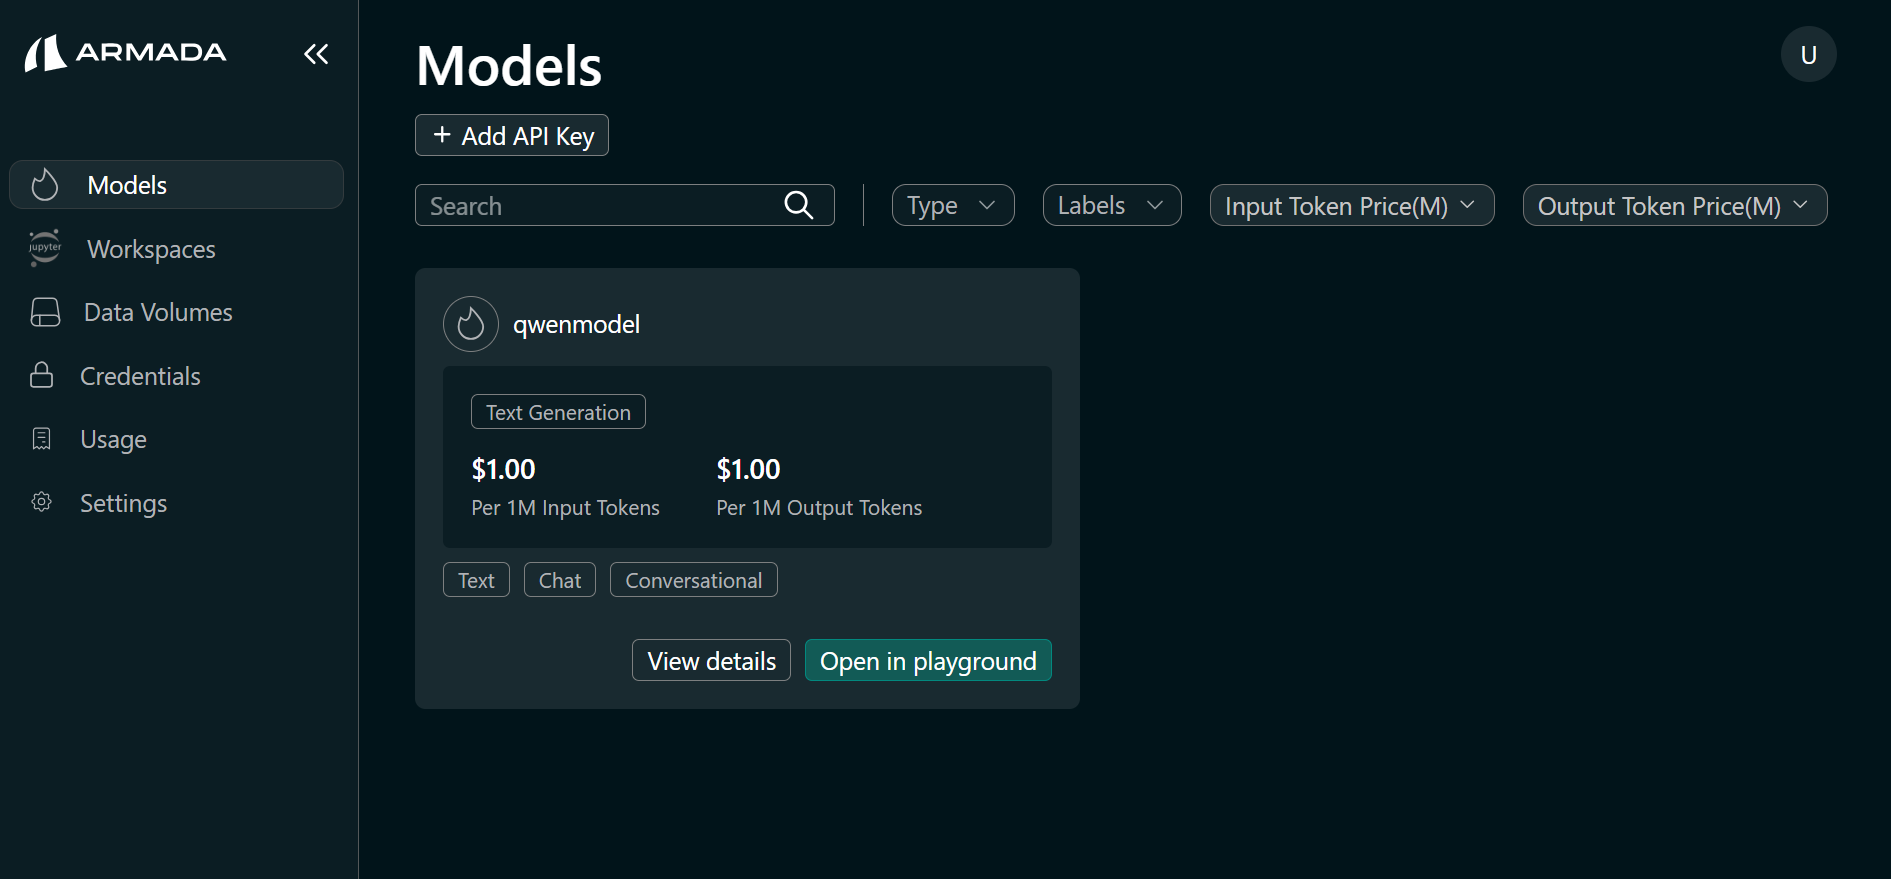
- Locate the model you want to monitor.
- Click View details on the model.
Step 3: View Performance Metrics
-
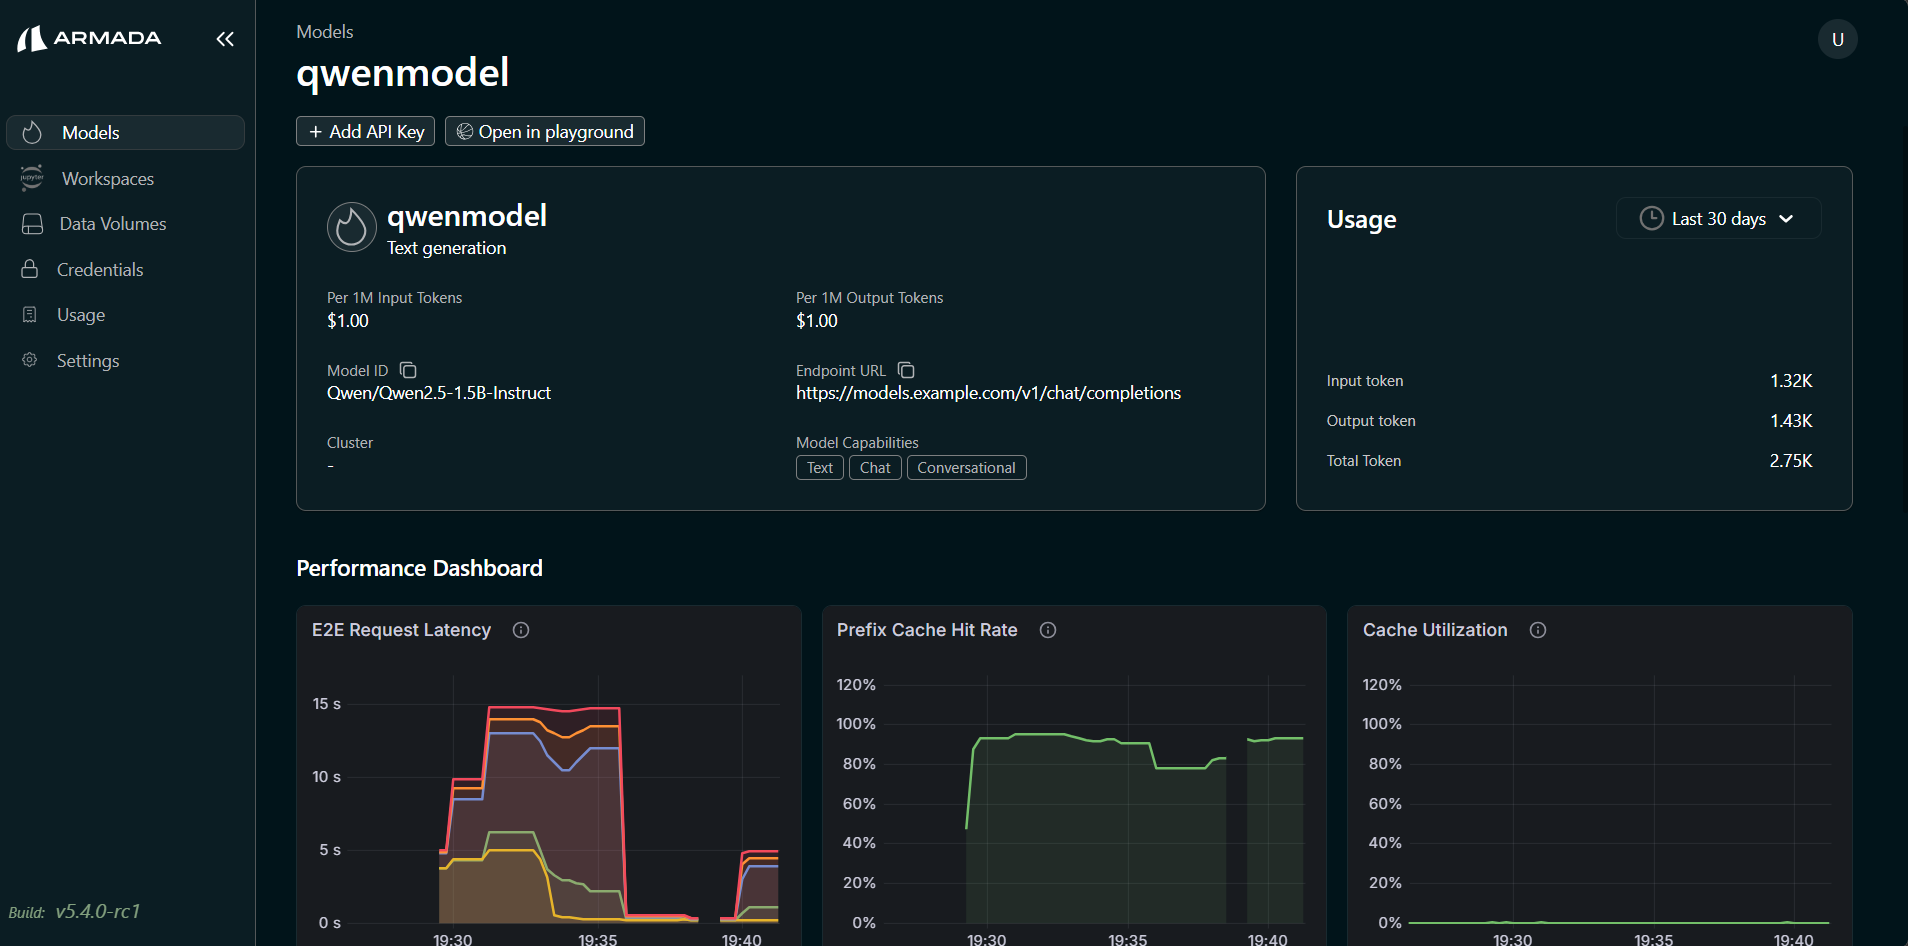
The model details page shows usage stats and the following performance metrics:
Usage
- Input Token
- Output Token
- Total Token
Performance Dashboard
- E2E Request Latency
- Prefix Cache Hit Rate
- Cache Utilization
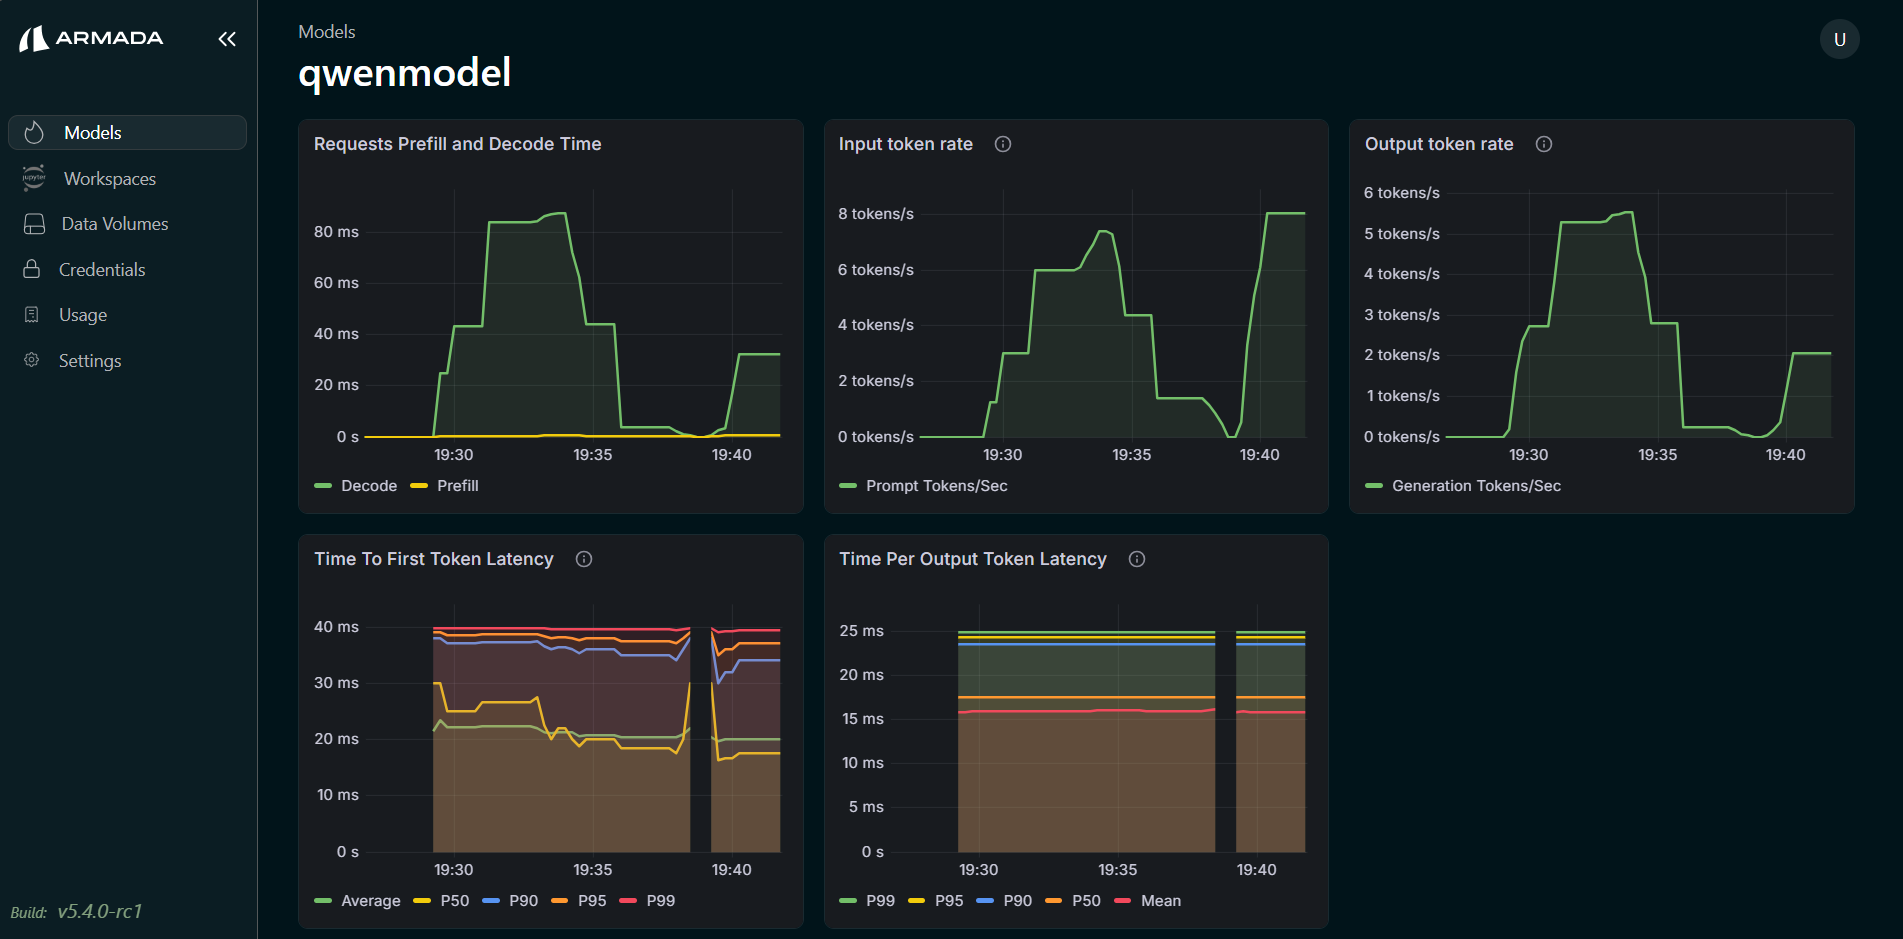
- Requests Prefill and Decode Time
- Input Token Rate
- Output Token Rate
- Time To First Token Latency (with P50, P90, P95, P99 percentiles)
- Time Per Output Token Latency (with P50, P90, P95, P99, Mean)
Next Steps
- Access Model Playground — Test deployed AI models interactively by sending prompts and inspecting responses in real time.
- Generate API Key — Create API keys to authenticate programmatic access to deployed models.