Tenant Dashboard
Overview
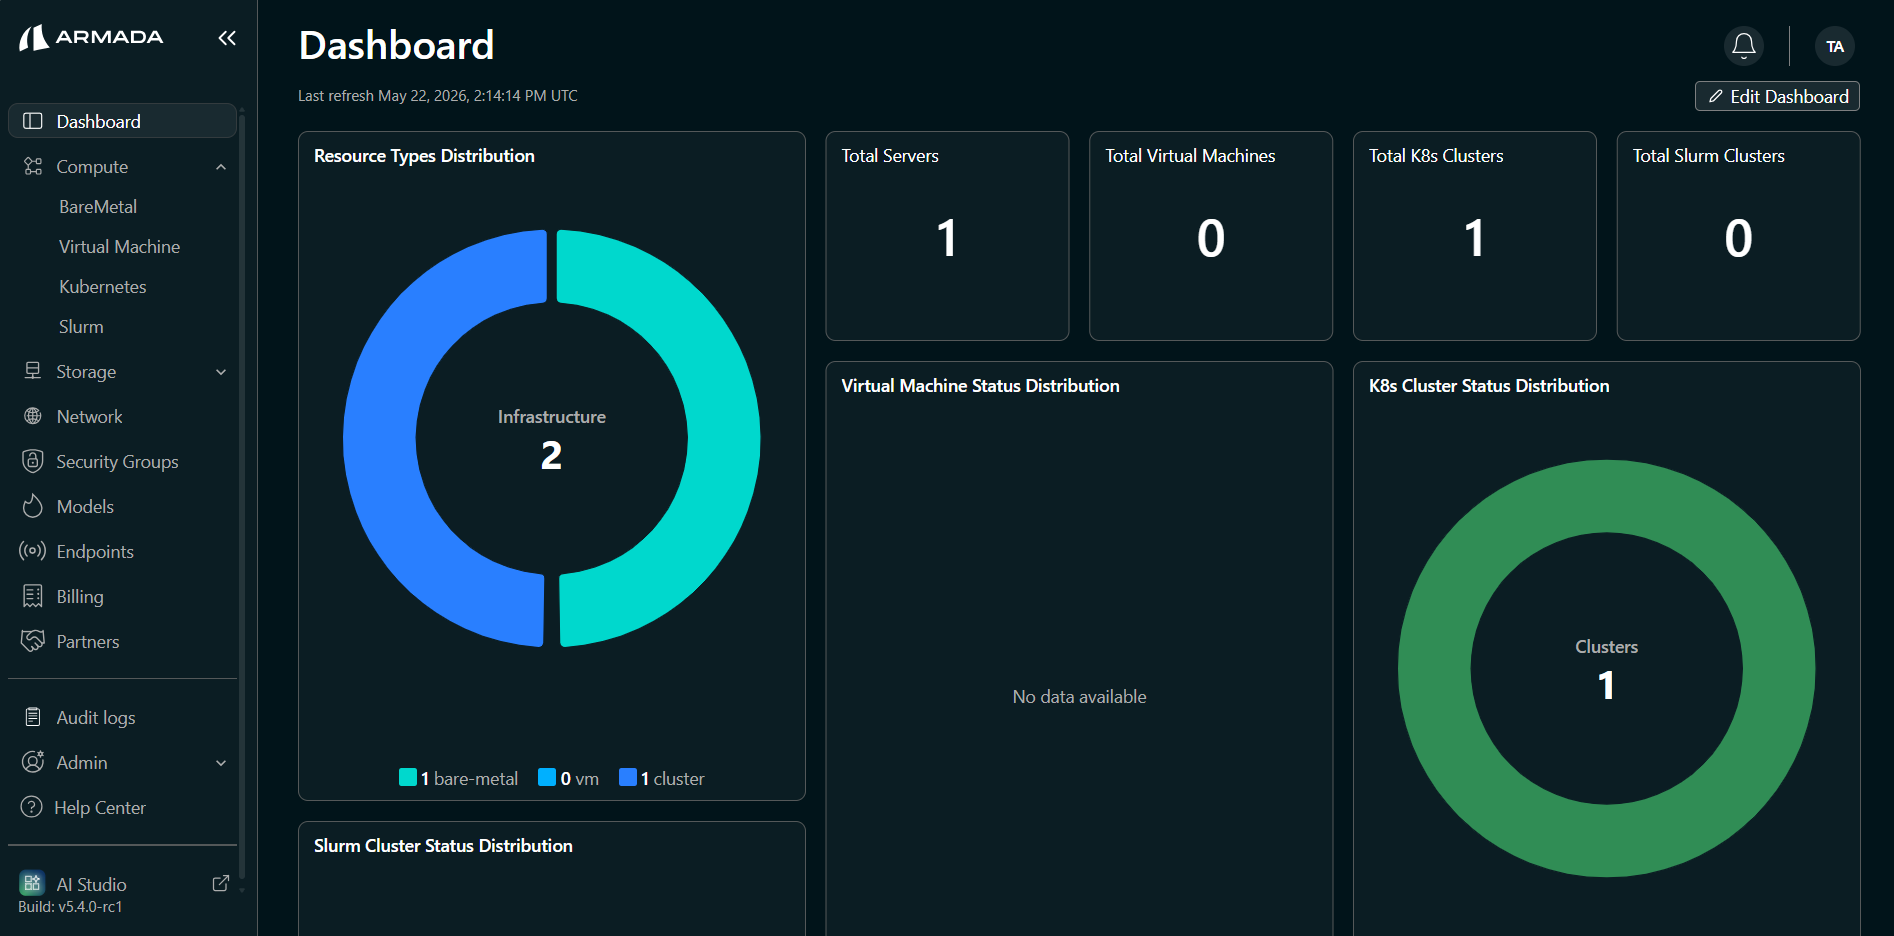
After logging in as a tenant admin, you will be redirected to the Dashboard page. The dashboard displays an overview of Bare Metal, Virtual Machine, Kubernetes cluster, and Slurm resources, as shown below.
Prerequisites
- Tenant Admin access — You must be logged in as a Tenant Admin to access the dashboard.
Accessing the Dashboard
Upon logging in as a Tenant Admin, you will be directed to the Tenant Dashboard.
Dashboard Components
Resource Overview
The dashboard displays:
- Allocated Resources - Your current quota and usage
- GPU Availability - Free GPUs and allocated GPUs
- Virtual Machines - Running VMs and available capacity
- Clusters - List of your clusters
- Storage - Storage utilization
Resource Status
Monitor the status of:
- Running Clusters - Active clusters and their health
- Deployed Models - Models currently deployed
- Active Endpoints - Service endpoints in use
- Pending Operations - Jobs and operations in progress
Key Metrics
The dashboard typically shows:
- Total GPUs allocated to your tenant
- Free GPUs available for allocation
- Number of active Virtual Machines
- Number of running clusters
- Deployed models count
- Active endpoints count
Navigation
From the dashboard, you can navigate to:
- Resource Allocation - Allocate servers and VMs
- Clusters - Manage your clusters
- Models - Deploy and manage models
- Endpoints - Create and manage service endpoints
- Settings - Configure tenant settings
Next Steps
- Allocate Bare Metal Resources — Allocate bare metal servers with GPU resources to your tenant.
- Create Your First Cluster — Create a Kubernetes cluster using available cluster templates.
- Deploy Hugging Face Model — Deploy open-source models from Hugging Face Hub.
- Deploy NIM Model — Deploy GPU-optimized NVIDIA NIM inference containers.
- Deploy Azure ML Model — Deploy models from your Azure ML model registry.