Access Model Playground
Overview
The Model Playground is an interactive interface in Bridge that lets you test deployed models, run predictions, and validate model behavior before integrating them into production applications.
Use the playground to:
- Send prompts and inspect model responses in real time
- Verify that a deployed model behaves as expected
- Iterate on prompts and parameters without writing code
- Share the playground URL with your team for quick testing (within tenant isolation)
Prerequisites
- Deployed model — A model must be deployed by a Tenant Admin. See Deploy Hugging Face Model, Deploy NIM Model, or Deploy Azure ML Model for details.
- Tenant User access — You must log in as a Tenant User to access the Model Playground.
Accessing the Model Playground
Step 1: Open AI Studio
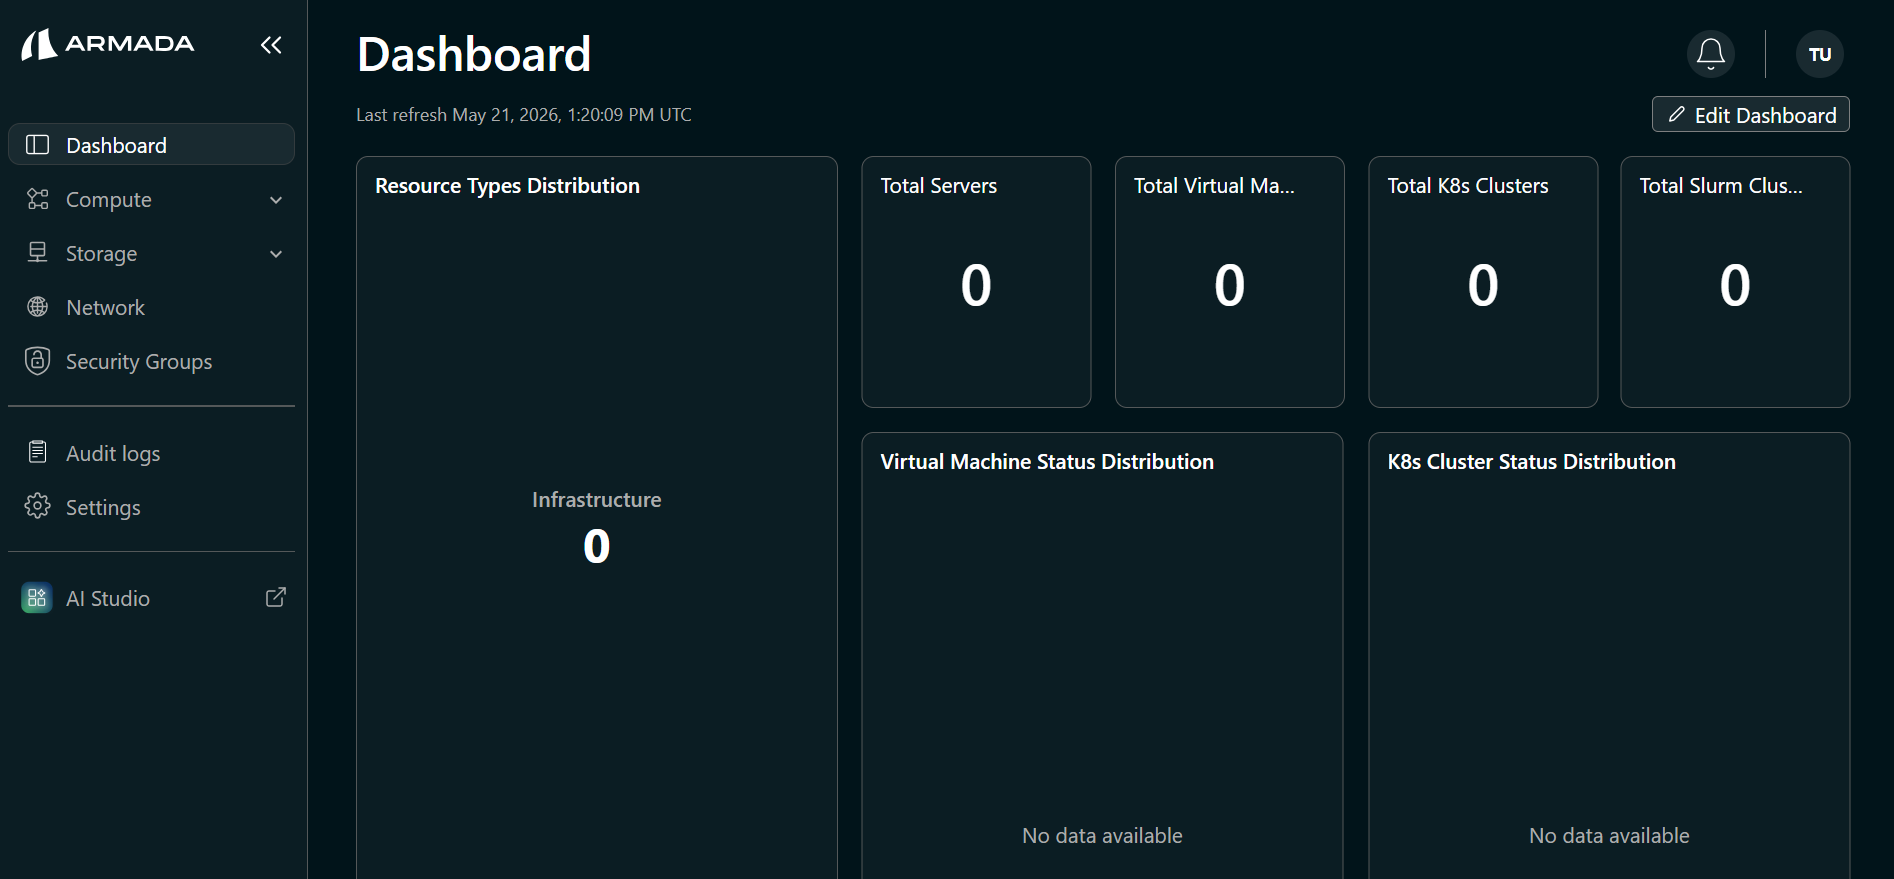
- Log in to Bridge as a tenant user.
- In the left sidebar, click AI Studio. This opens AI Studio in a new tab.
Step 2: Open the Model in the Playground
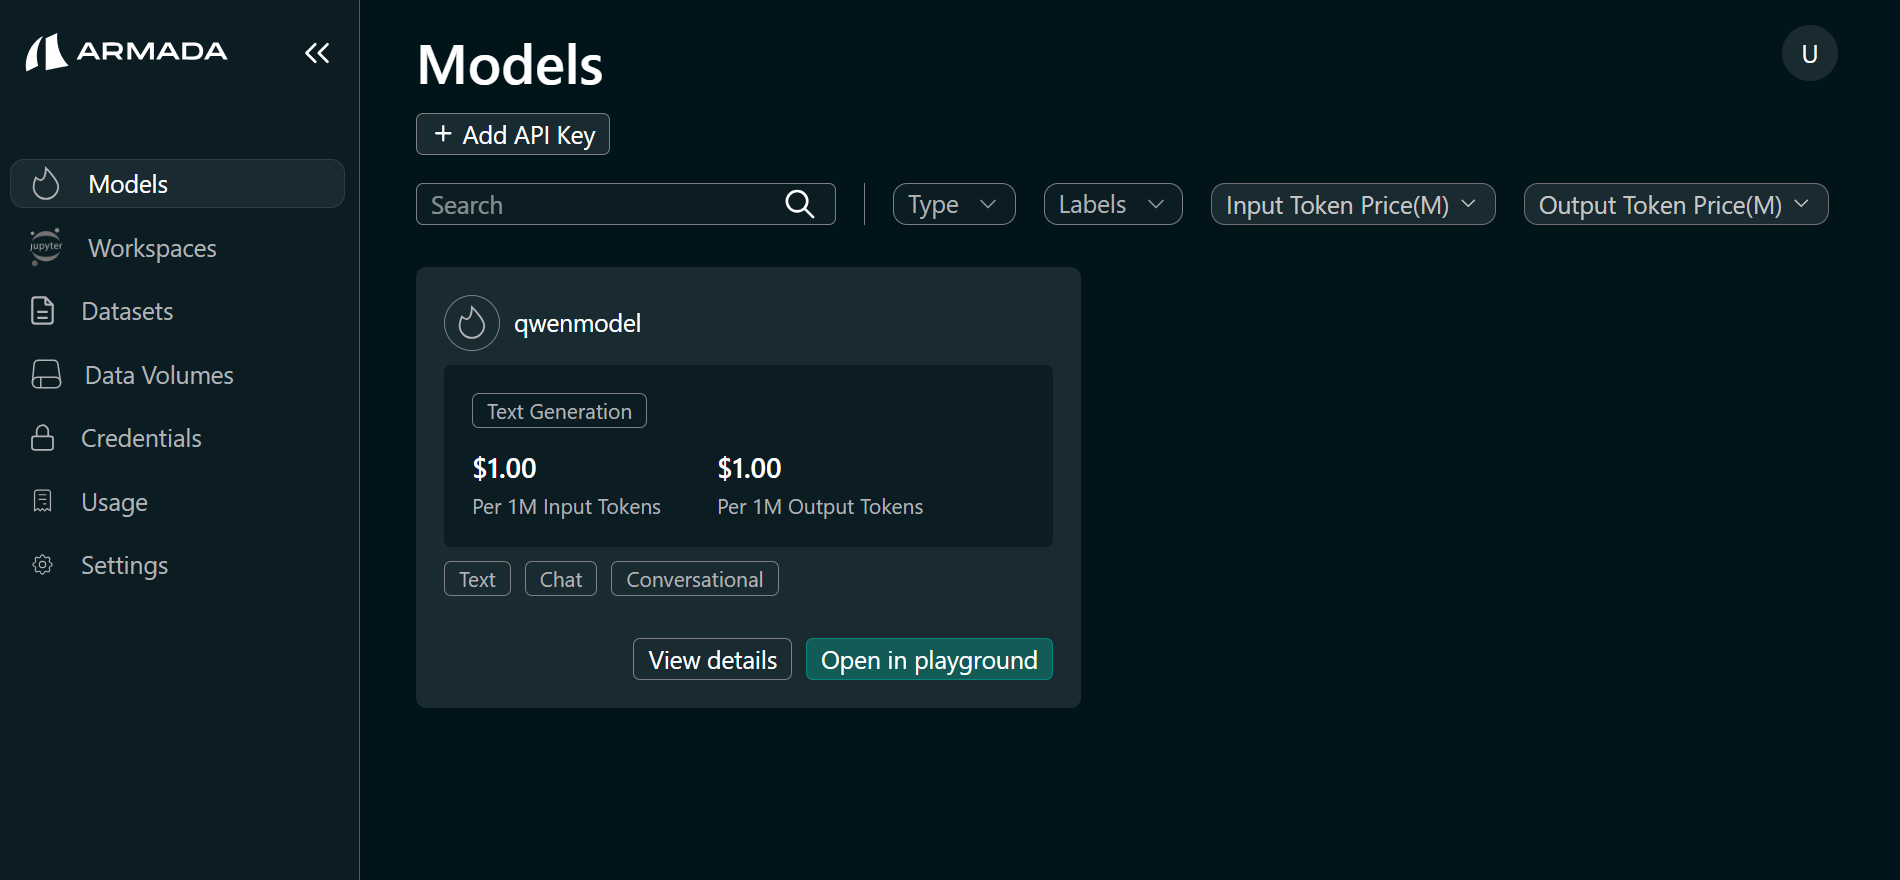
- In the AI Studio tab, click Models in the sidebar.
- Locate the deployed model and click Open in Playground.
Step 3: Handle the First-Login Browser Security Warning
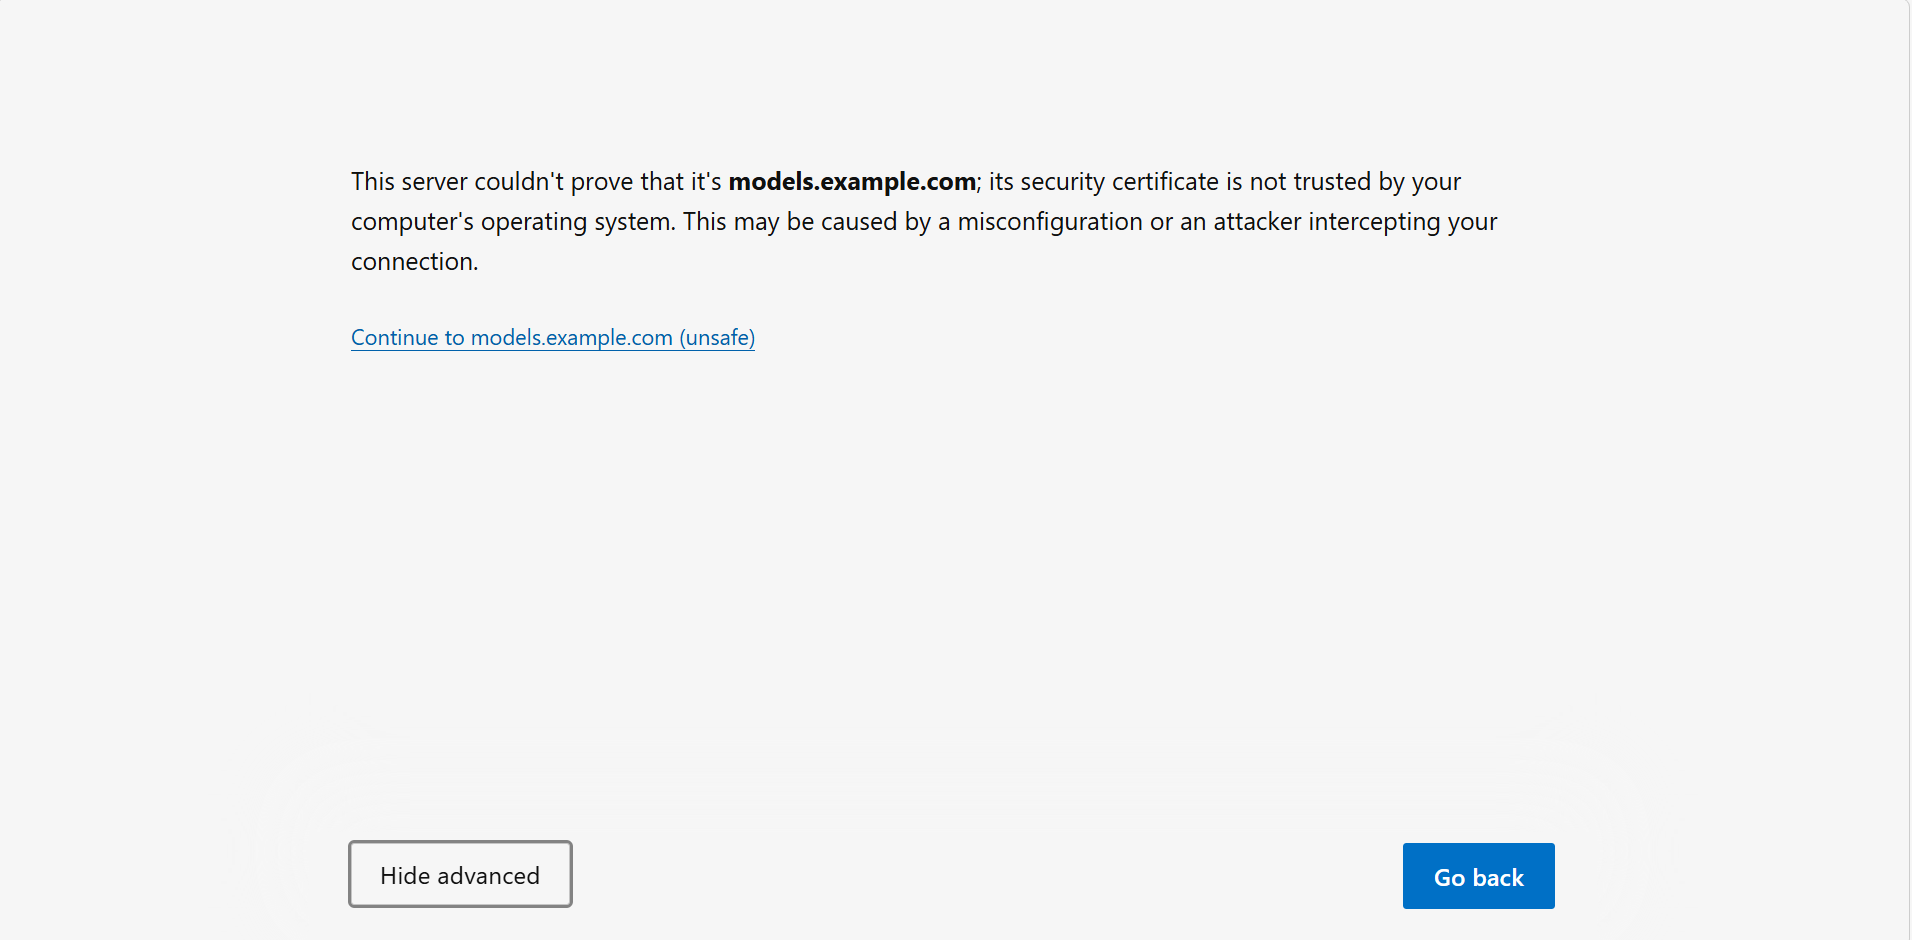
On the first login, the Playground may display an error message if the model endpoint does not have an authorized certificate. To resolve this:
- Copy the model endpoint URL from Playground page.
- Open a new browser tab and paste the URL.
- When the browser shows a security warning, click Advanced.
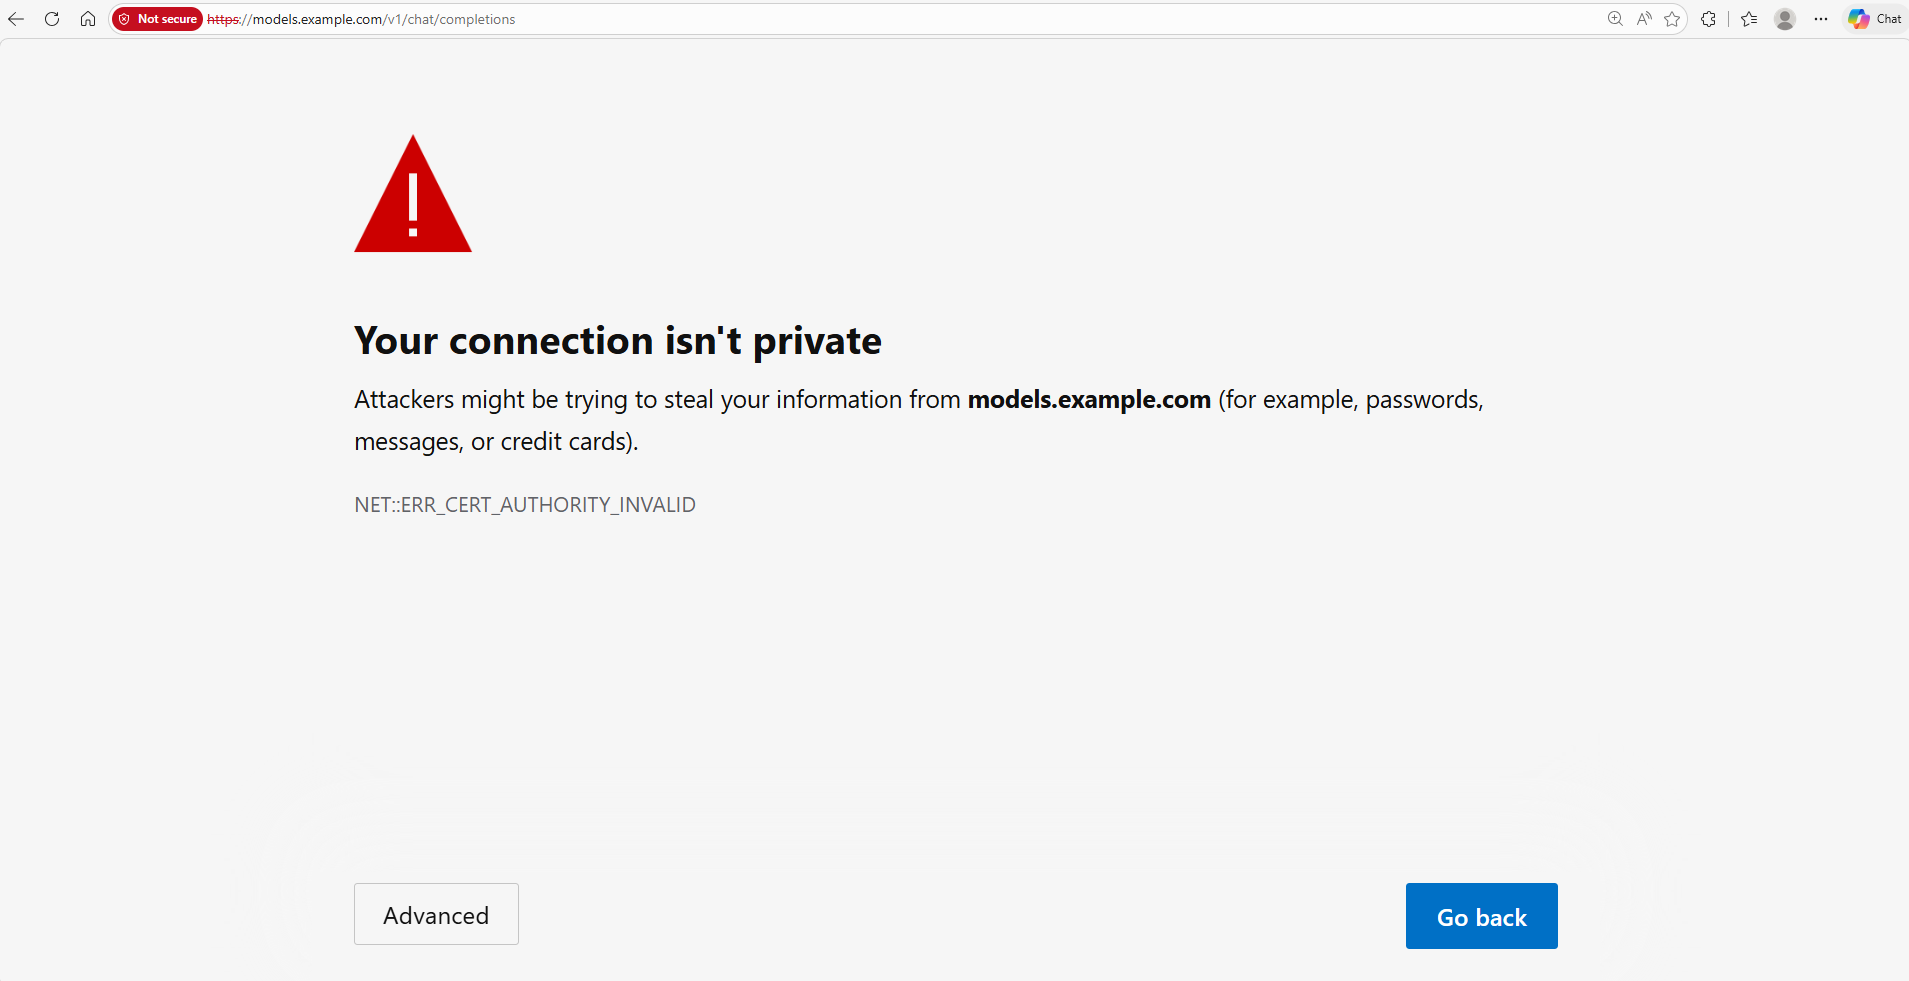
- Click Proceed to [site] (unsafe) or Accept the risk and continue.
- The browser will show a "Missing Authorization header" message — this is expected.
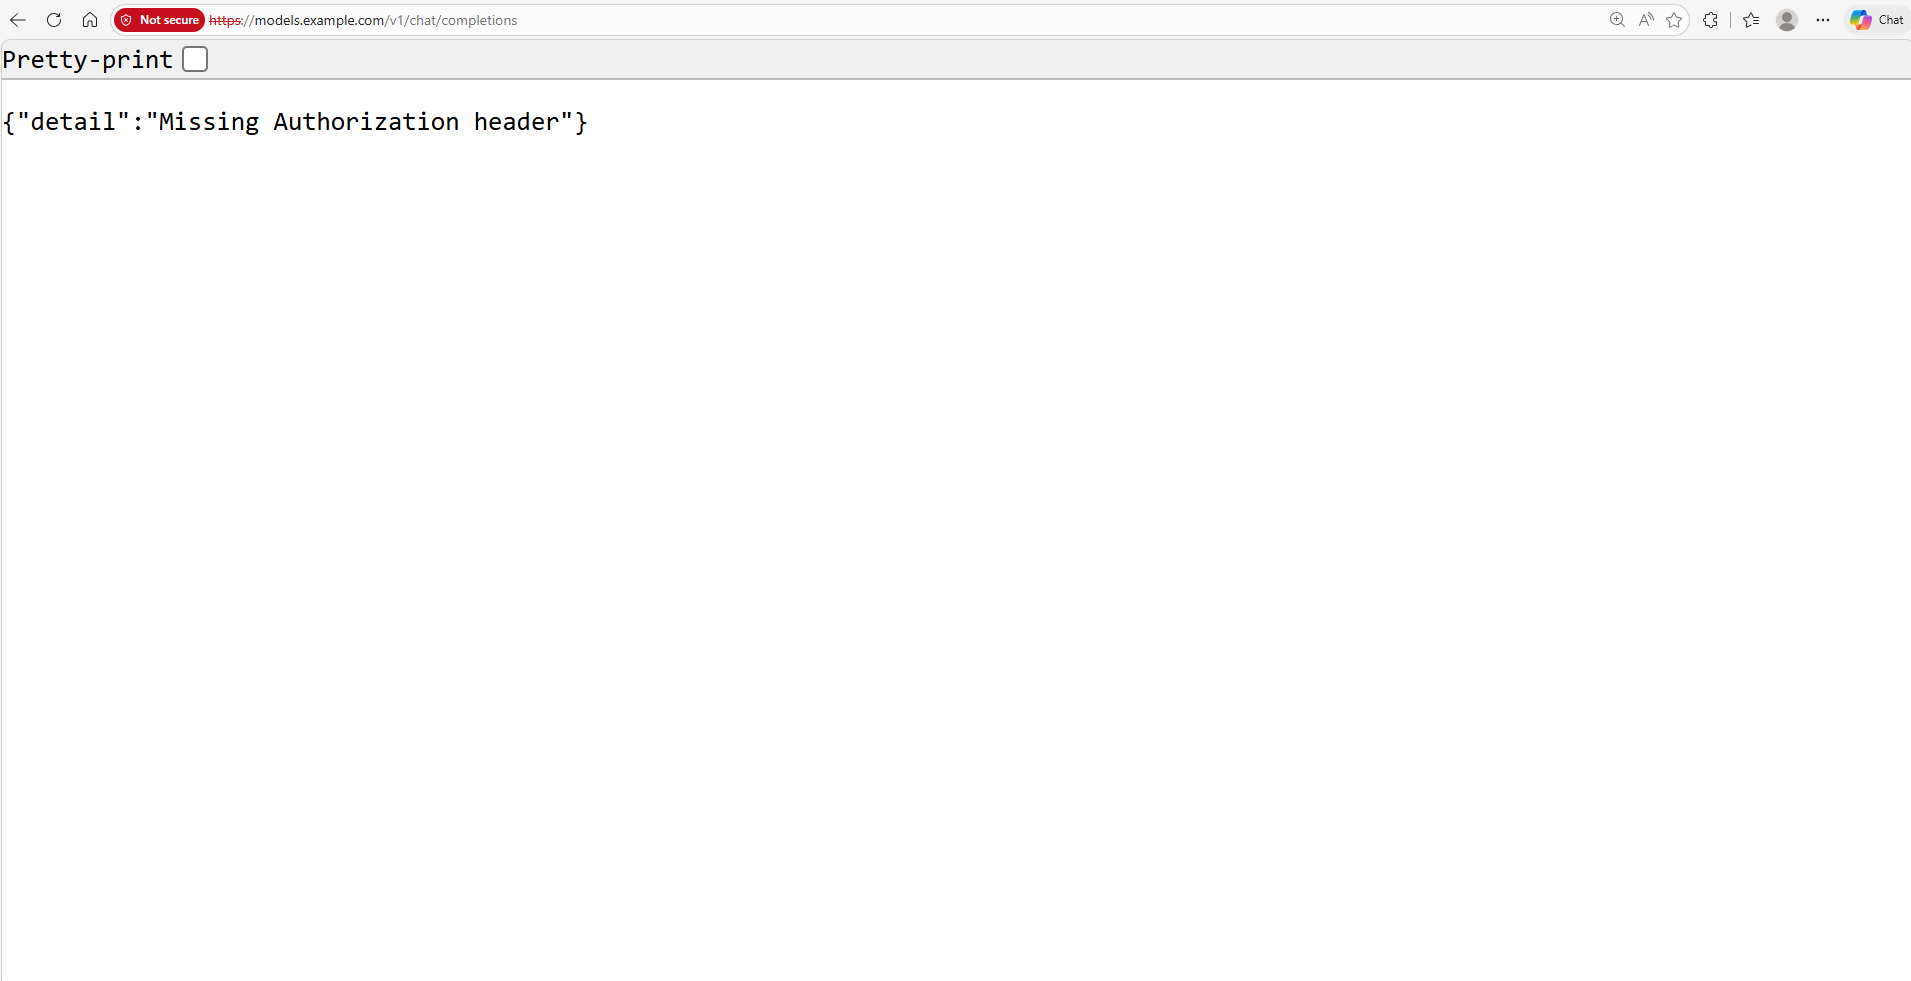
- Return to the Playground tab and refresh the page if needed.
This one-time step establishes trust for the endpoint in your browser. You do not need to repeat it for the same endpoint.
Step 4: Run Queries
- You can now run queries in the prompting interface.
Tenant user isolation is enforced in Bridge. One tenant user cannot see or use another tenant user's Model Playground. Each tenant user (for example, tenantuser1 and tenantuser2) must complete the steps above with their own login to access their own model playground.
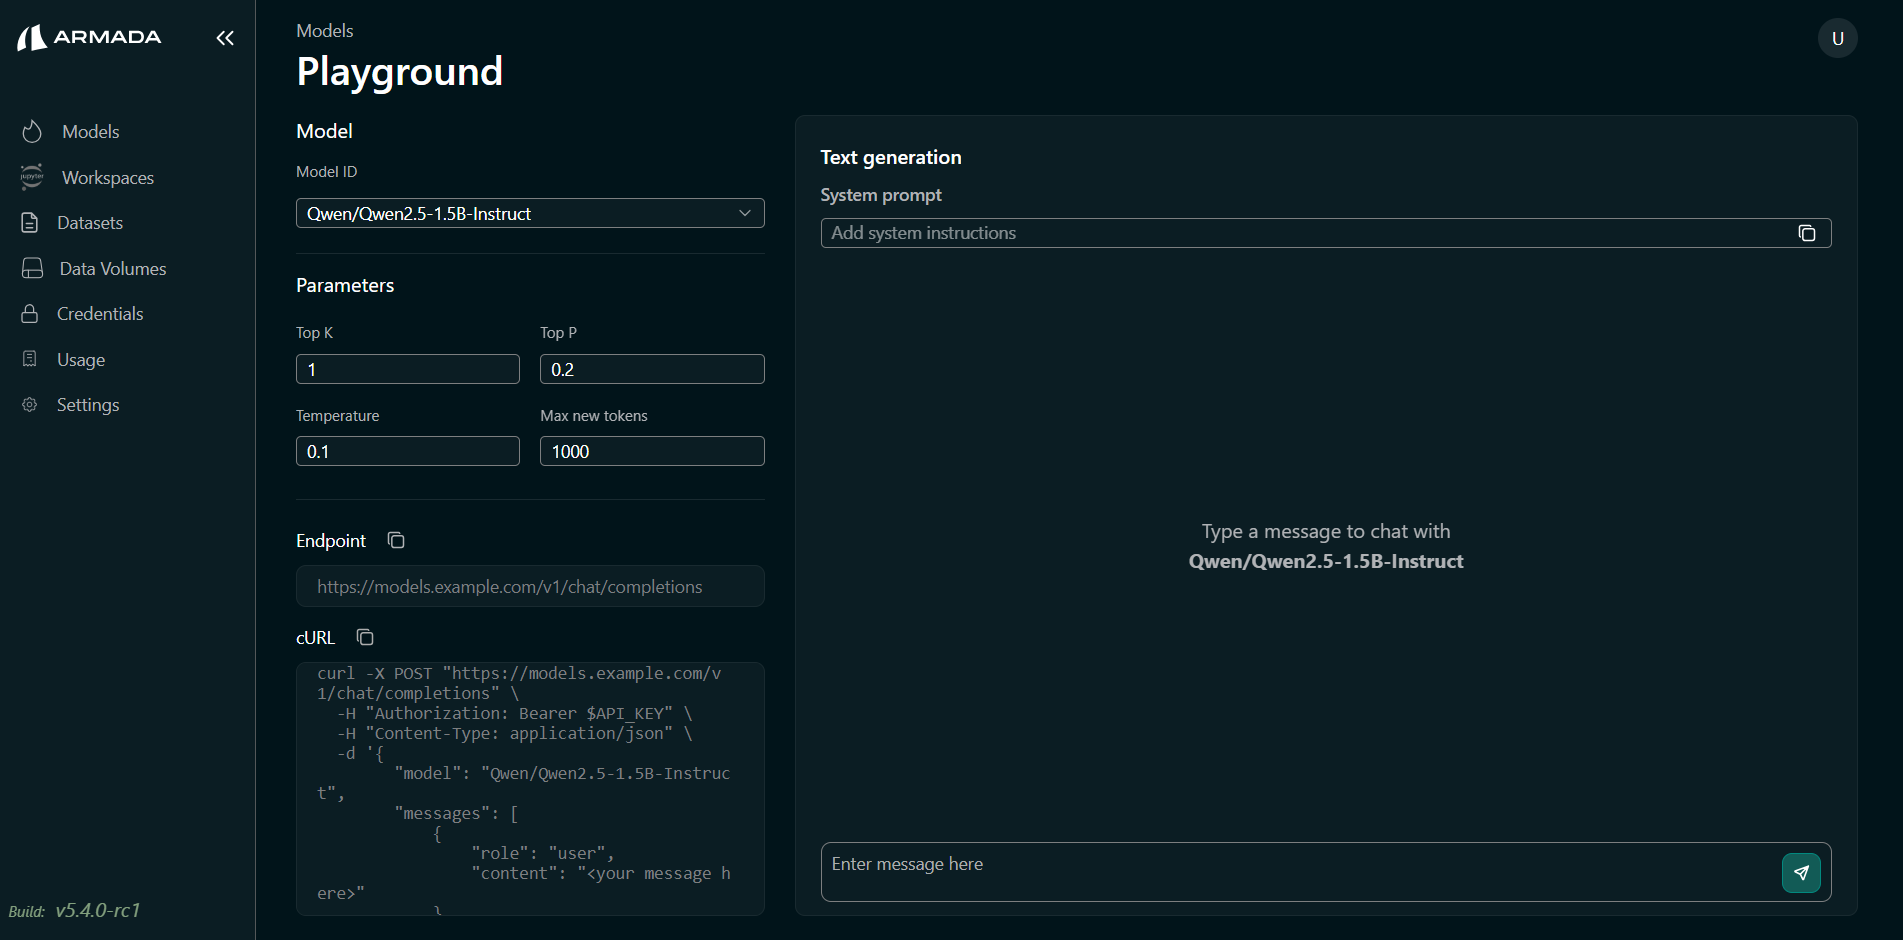
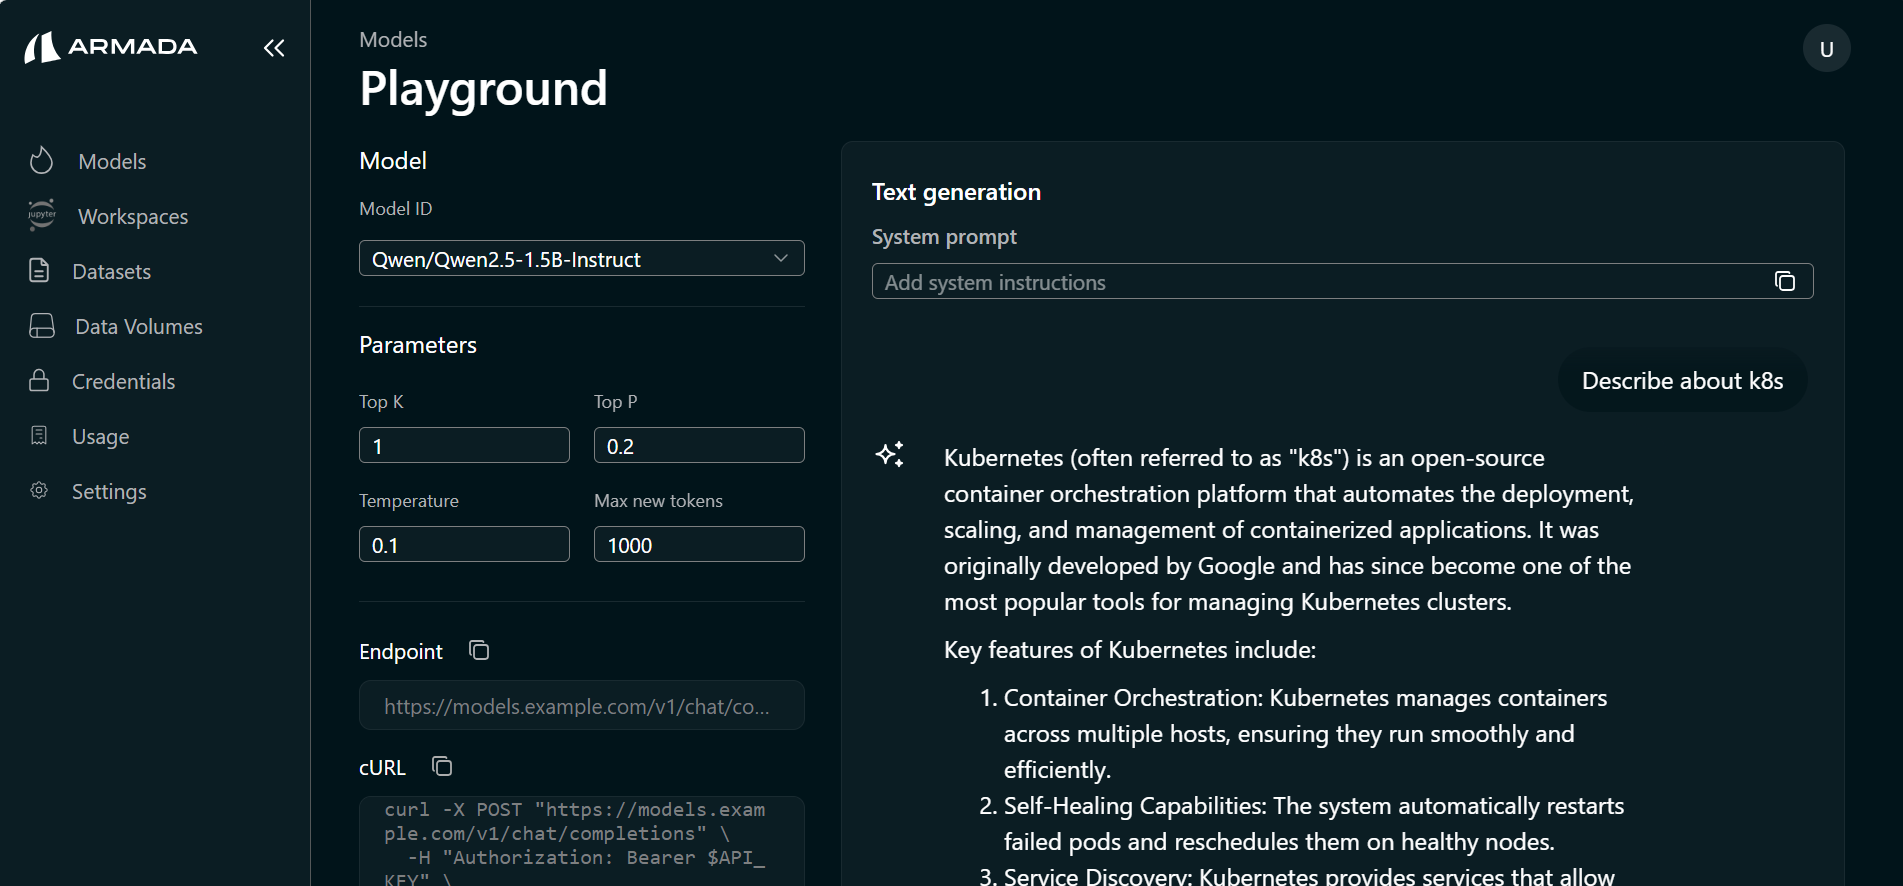
Using the Playground
In the prompting interface you can:
- Enter text prompts and submit them to the deployed model
- View the model’s response in the same screen
- Adjust parameters (if supported by the model) and re-run tests
Use these results to validate behavior before calling the model from applications or APIs.
Playground Interface
The playground provides:
- Input Editor - Define model inputs
- Prediction Viewer - View model outputs
- History - Track prediction calls
- Export - Save test results
Test Models
Single Prediction
Make a single prediction:
- Enter input data in the input editor
- Click Predict or Submit
- View model output
{
  "inputs": {
    "feature1": 1.0,
    "feature2": 2.0,
    "feature3": 3.0
  }
}
Output:
{
  "prediction": 0.95,
  "confidence": 0.98
}
Batch Predictions
Test multiple inputs:
- Prepare CSV or JSON file with multiple inputs
- Upload file to playground
- Submit batch request
- Download results
feature1,feature2,feature3
1.0,2.0,3.0
2.0,3.0,4.0
3.0,4.0,5.0
Input Formats
JSON Format
{
  "instances": [
    [1.0, 2.0, 3.0],
    [2.0, 3.0, 4.0]
  ]
}
CSV Format
col1,col2,col3
1.0,2.0,3.0
2.0,3.0,4.0
Text Format
Raw text input for text models
Validate Models
Check Predictions
Verify model behaves correctly:
- Test with known inputs
- Verify expected outputs
- Check confidence scores
- Test edge cases
Test Different Inputs
Explore model behavior:
{
  "test_cases": [
    {"normal_input": [1.0, 2.0, 3.0]},
    {"edge_case": [0.0, 0.0, 0.0]},
    {"extreme": [100.0, 100.0, 100.0]}
  ]
}
Analyze Predictions
Review results:
- Prediction values
- Confidence scores
- Inference time
- Resource usage
Export Results
Download Predictions
Save test results:
- Run predictions
- Click Download Results
- Choose format (JSON, CSV, Excel)
Share Results
Share findings with team:
- Export results
- Include in reports
- Attach to documentation
- Reference in model validation
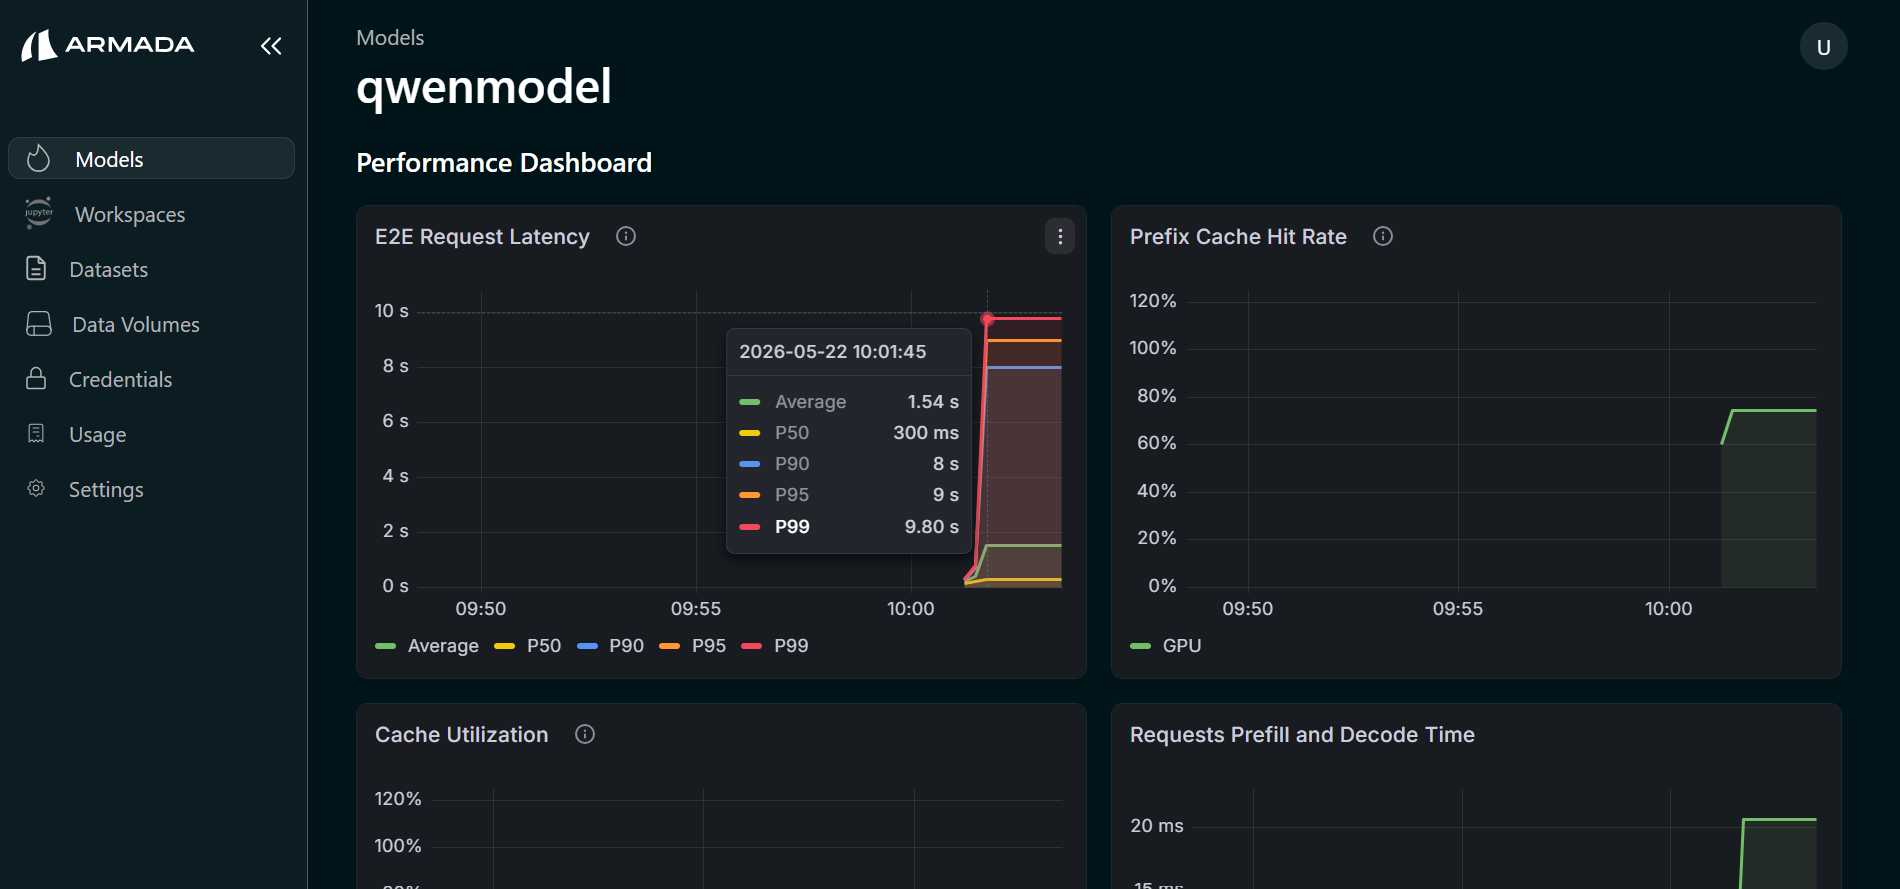
Performance Testing
Latency Testing
Measure model response time:
Request: 1.5 seconds
Average: 1.2 seconds (from 10 requests)
Throughput Testing
Test throughput capacity:
Requests per second: 100 RPS
Concurrent connections: 10
Resource Usage
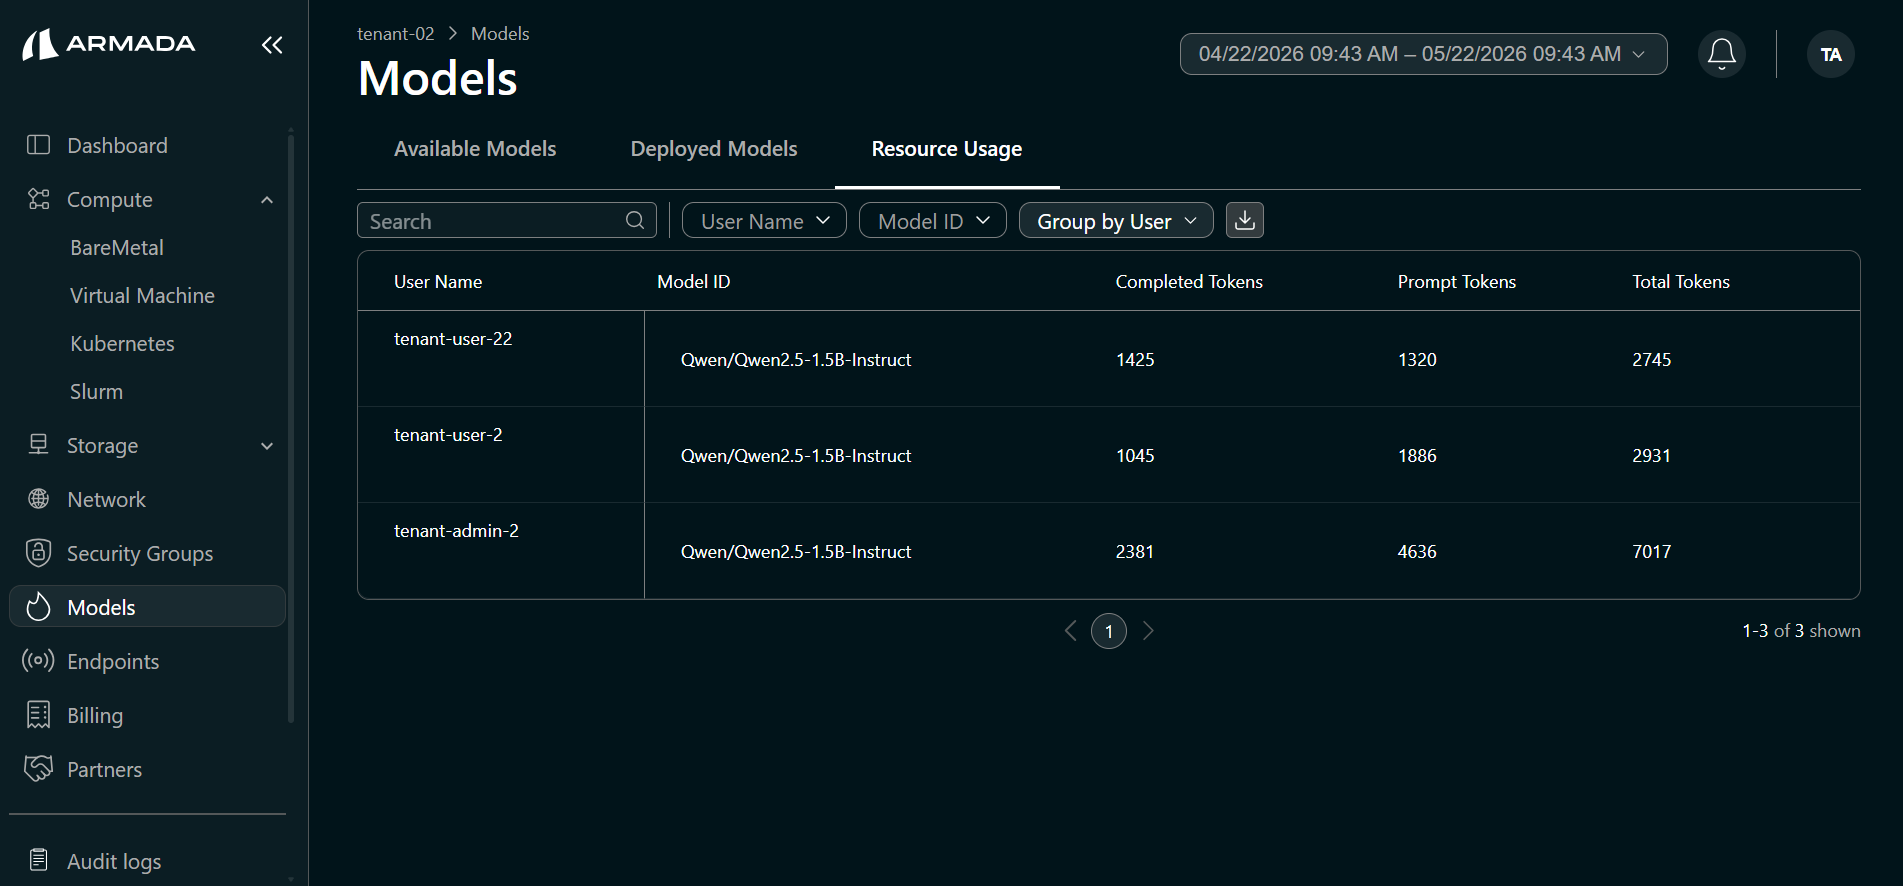
The Resource Usage tab displays token usage per model and per user (which user consumed how many tokens). The following fields are shown:
- Prompt tokens — tokens in the request input
- Completed tokens — tokens in the model output
- Total tokens — combined prompt and completion token count
- Model ID — model associated with the usage
- Username — tenant user associated with the usage
Debugging
View Model Logs
Check model serving logs:
[2024-01-09 10:15:32] Model loaded successfully
[2024-01-09 10:15:45] Prediction request: {input: [1,2,3]}
[2024-01-09 10:15:46] Inference complete: 0.95
Error Handling
Debug prediction errors:
- Check input format
- Verify input data types
- Check model requirements
- Review error messages
A/B Testing
Compare Models
Test multiple model versions:
- Deploy Model A and Model B
- Send same inputs to both
- Compare outputs
- Analyze differences
Model Comparison
{
  "model_a_output": 0.95,
  "model_b_output": 0.92,
  "difference": 0.03
}
Best Practices
Before Production
- Test with diverse inputs
- Validate edge cases
- Check performance metrics
- Review resource usage
- Document test results
Continuous Validation
- Regular model testing
- Monitor prediction distribution
- Track confidence scores
- Detect data drift
- Compare against baselines
Next Steps
- Deploy Hugging Face Model — Deploy open-source models from Hugging Face Hub.
- Deploy NIM Model — Deploy GPU-optimized NVIDIA NIM inference containers.
- Deploy Azure ML Model — Deploy models from your Azure ML model registry.
- Scale Models — Scale worker nodes up or down to match workload demands without recreating the cluster.