Allocating Virtual Machines (VMaaS)
Overview
Virtual Machine (VM) allocation lets you provision GPU-enabled or CPU-only virtual machines from your tenant quota. You choose the VM name, SSH key, GPU flavor, and operating system. After the VM is provisioned, you can view its details, monitor CPU and GPU metrics, view logs, and perform power actions (reboot, power off, power on) from Bridge UI.
Prerequisites
- Assigned quota from your NCP Admin
- Available VM capacity in the infrastructure
- Proper resource permissions
- Tenant admin login
Allocate a Virtual Machine
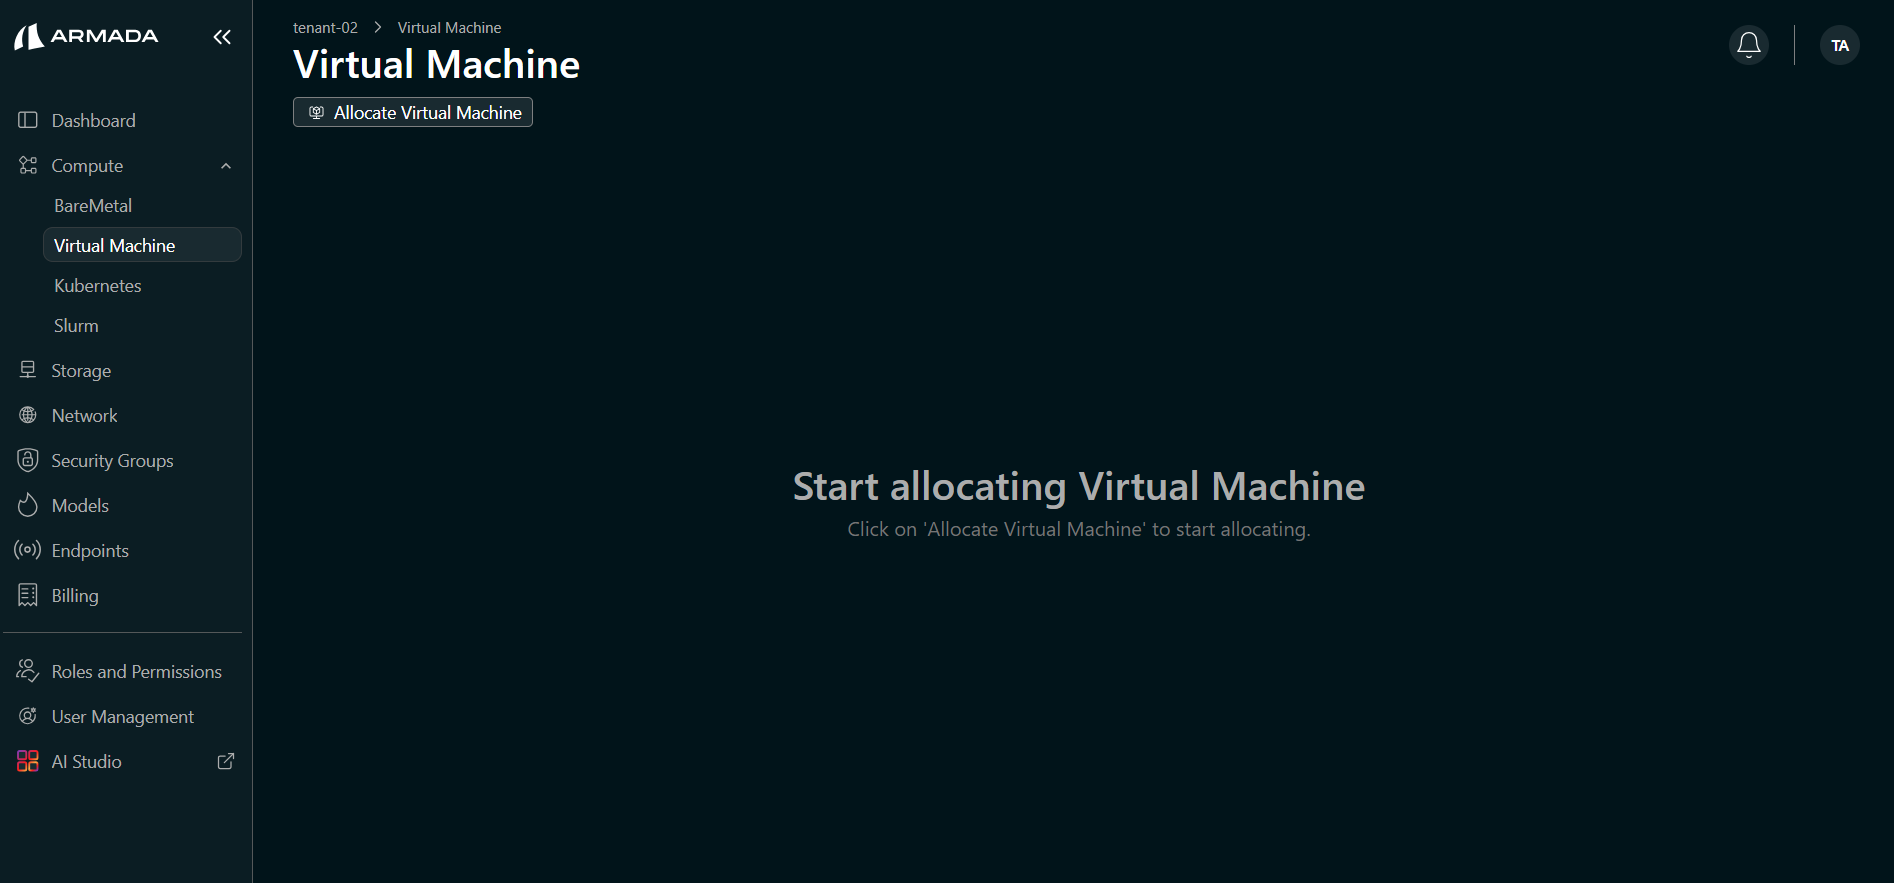
Step 1: Open the Virtual Machine allocation flow
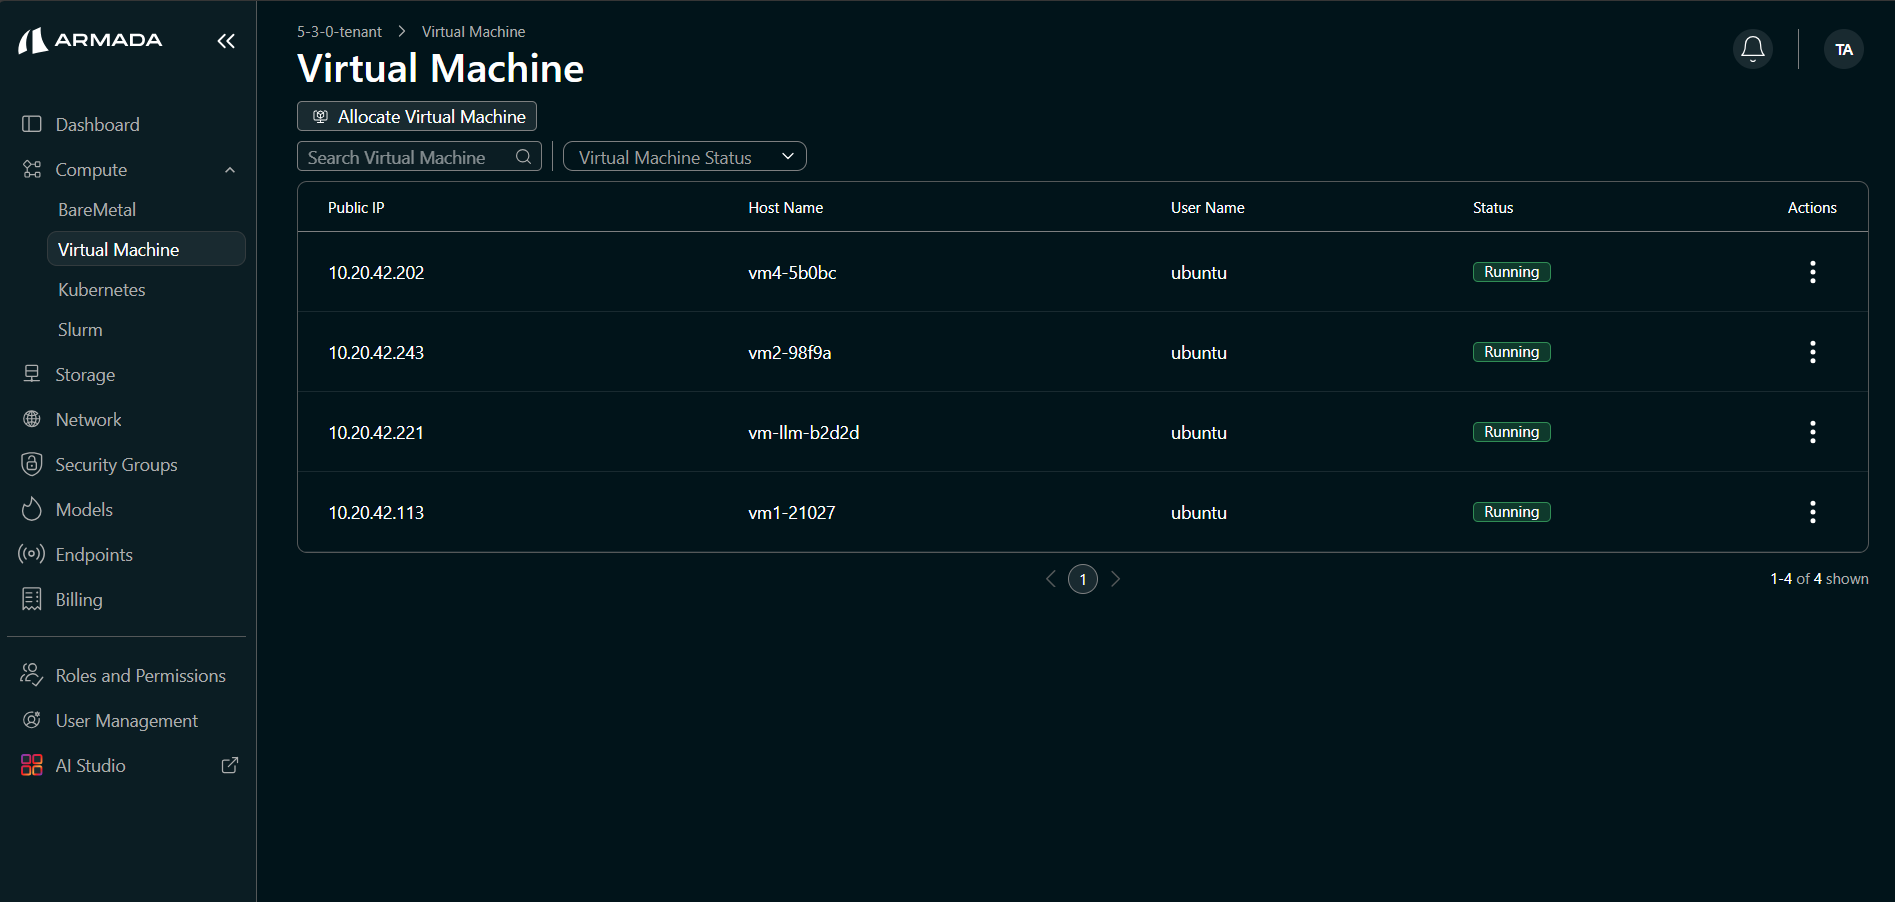
- Go to Compute → Virtual Machine.
- Click Allocate Virtual Machine.
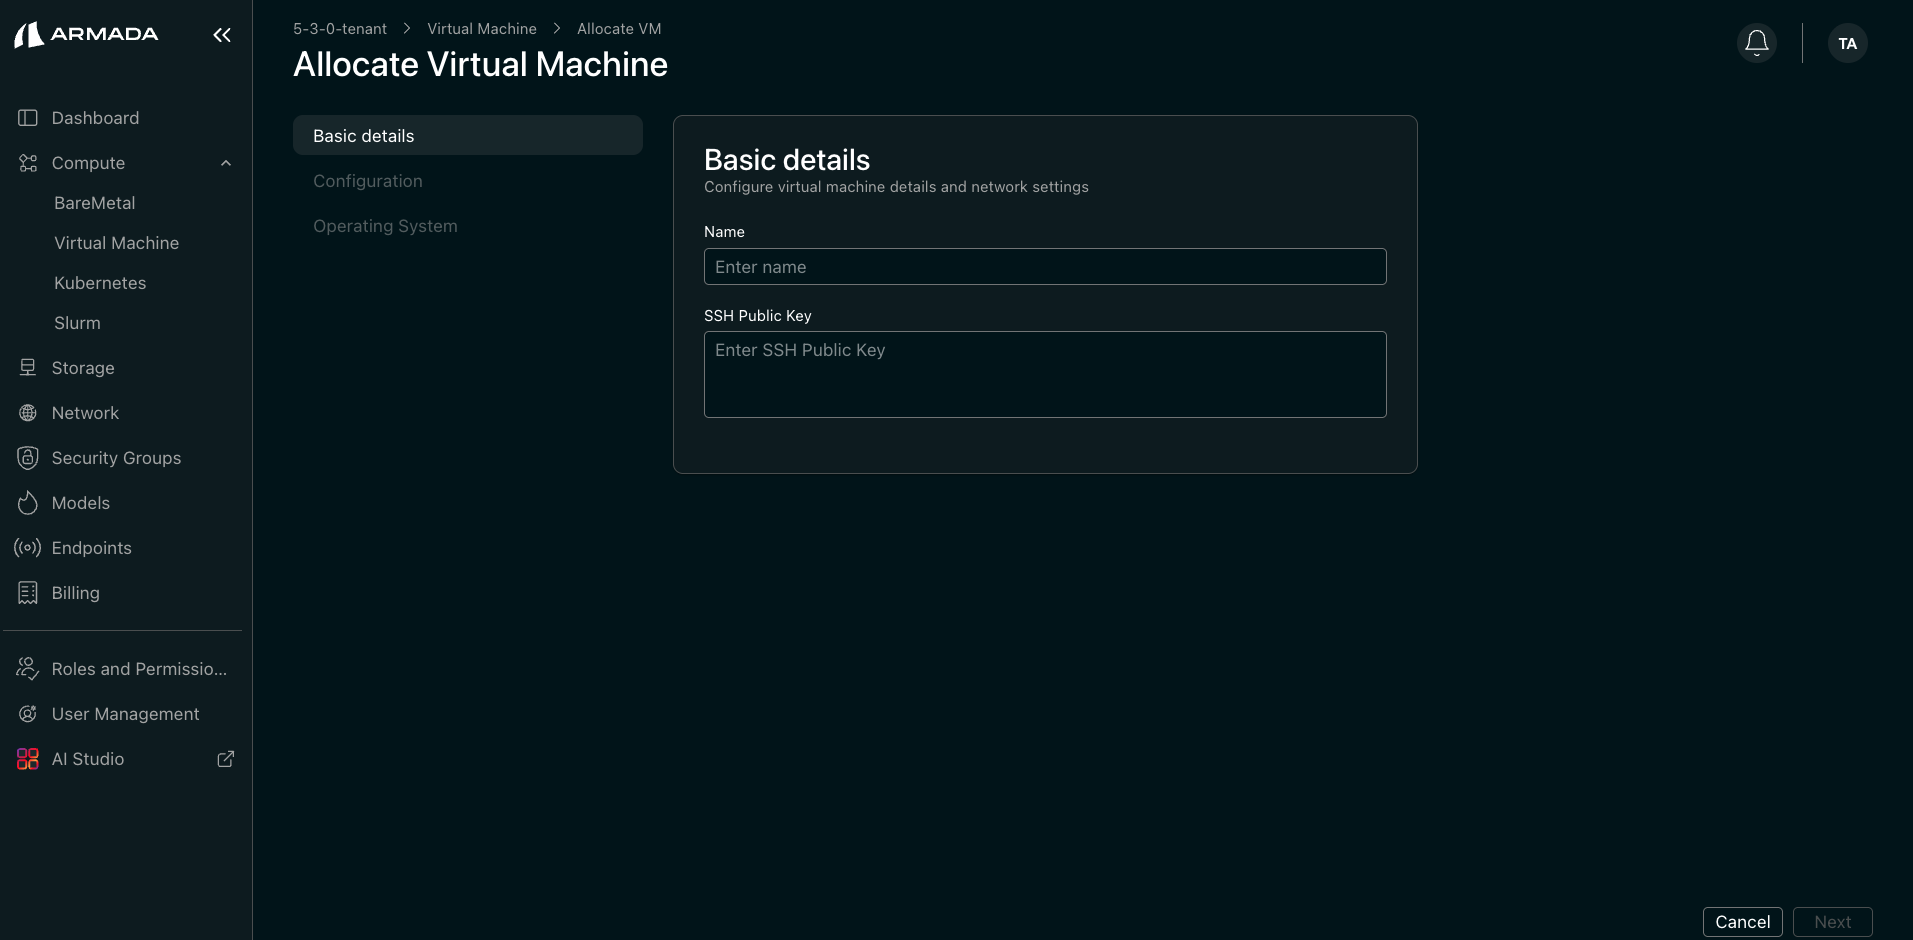
Step 2: Enter VM name and SSH key
- Enter a VM name.
- Add your SSH public key.
- Click Next.
note
After the VM is created, you can log in using the private key that matches the public key you provided.
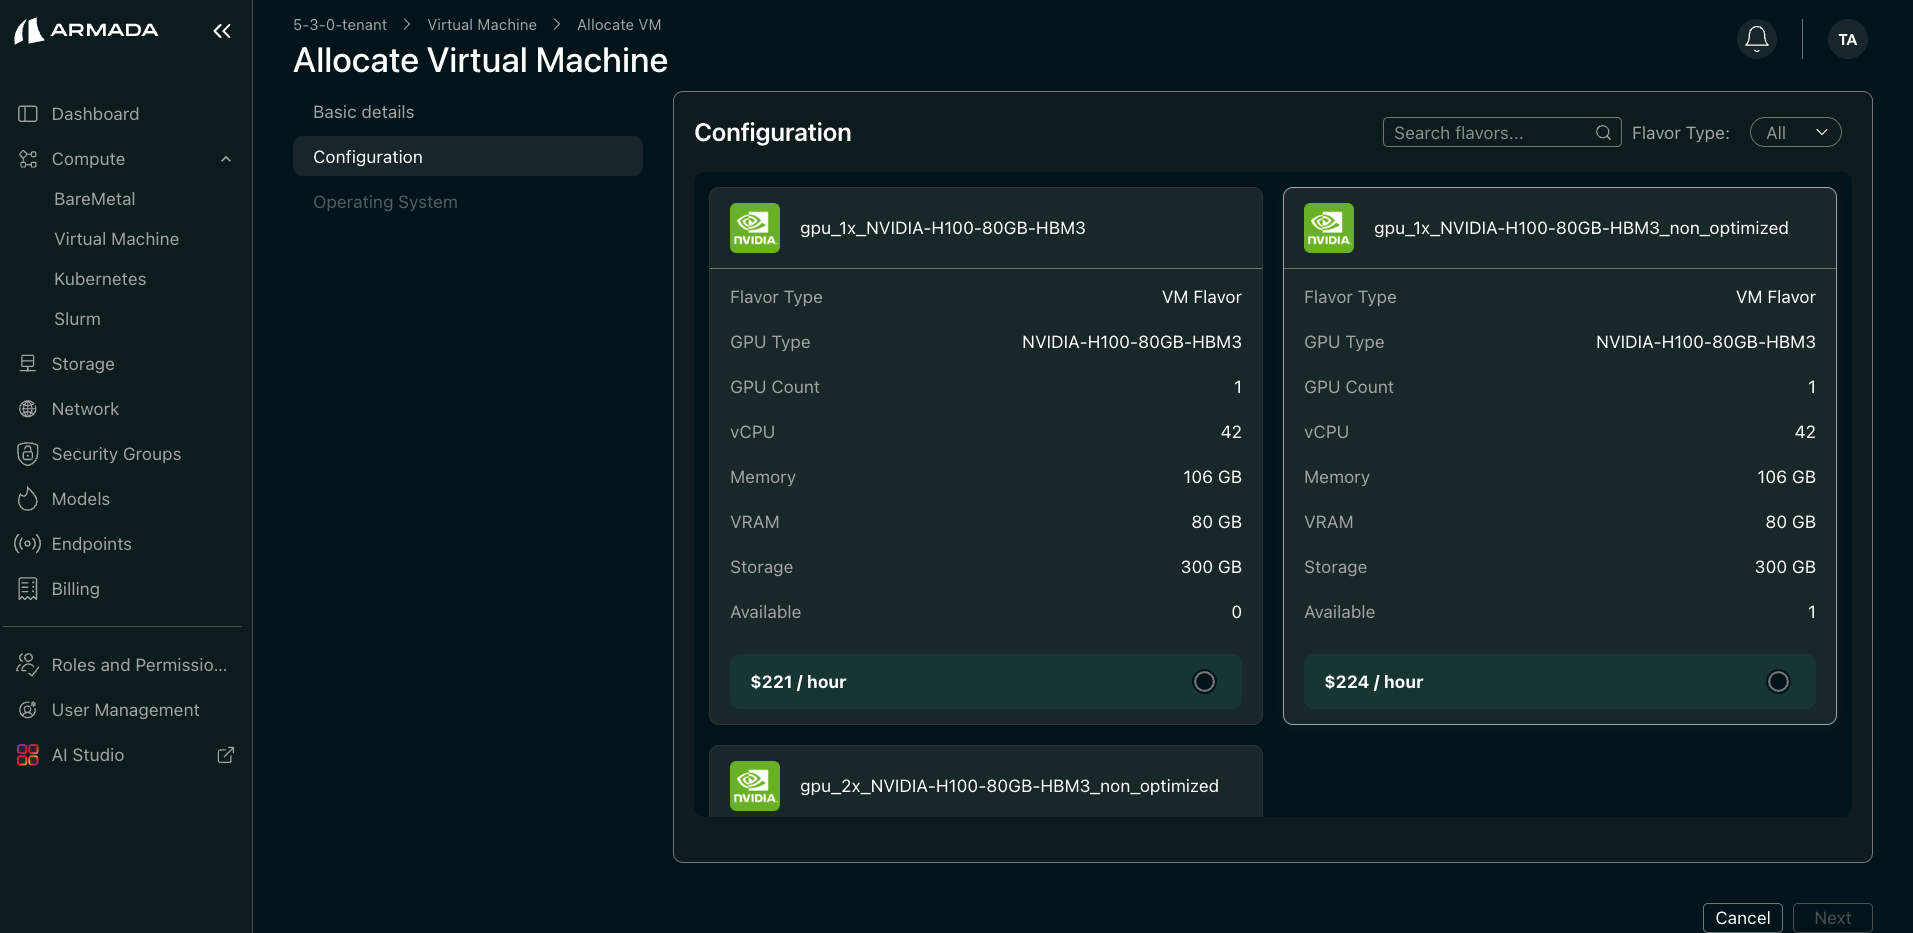
Step 3: Select GPU flavor
- Select the GPU flavor that matches your workload.
- Click Next.
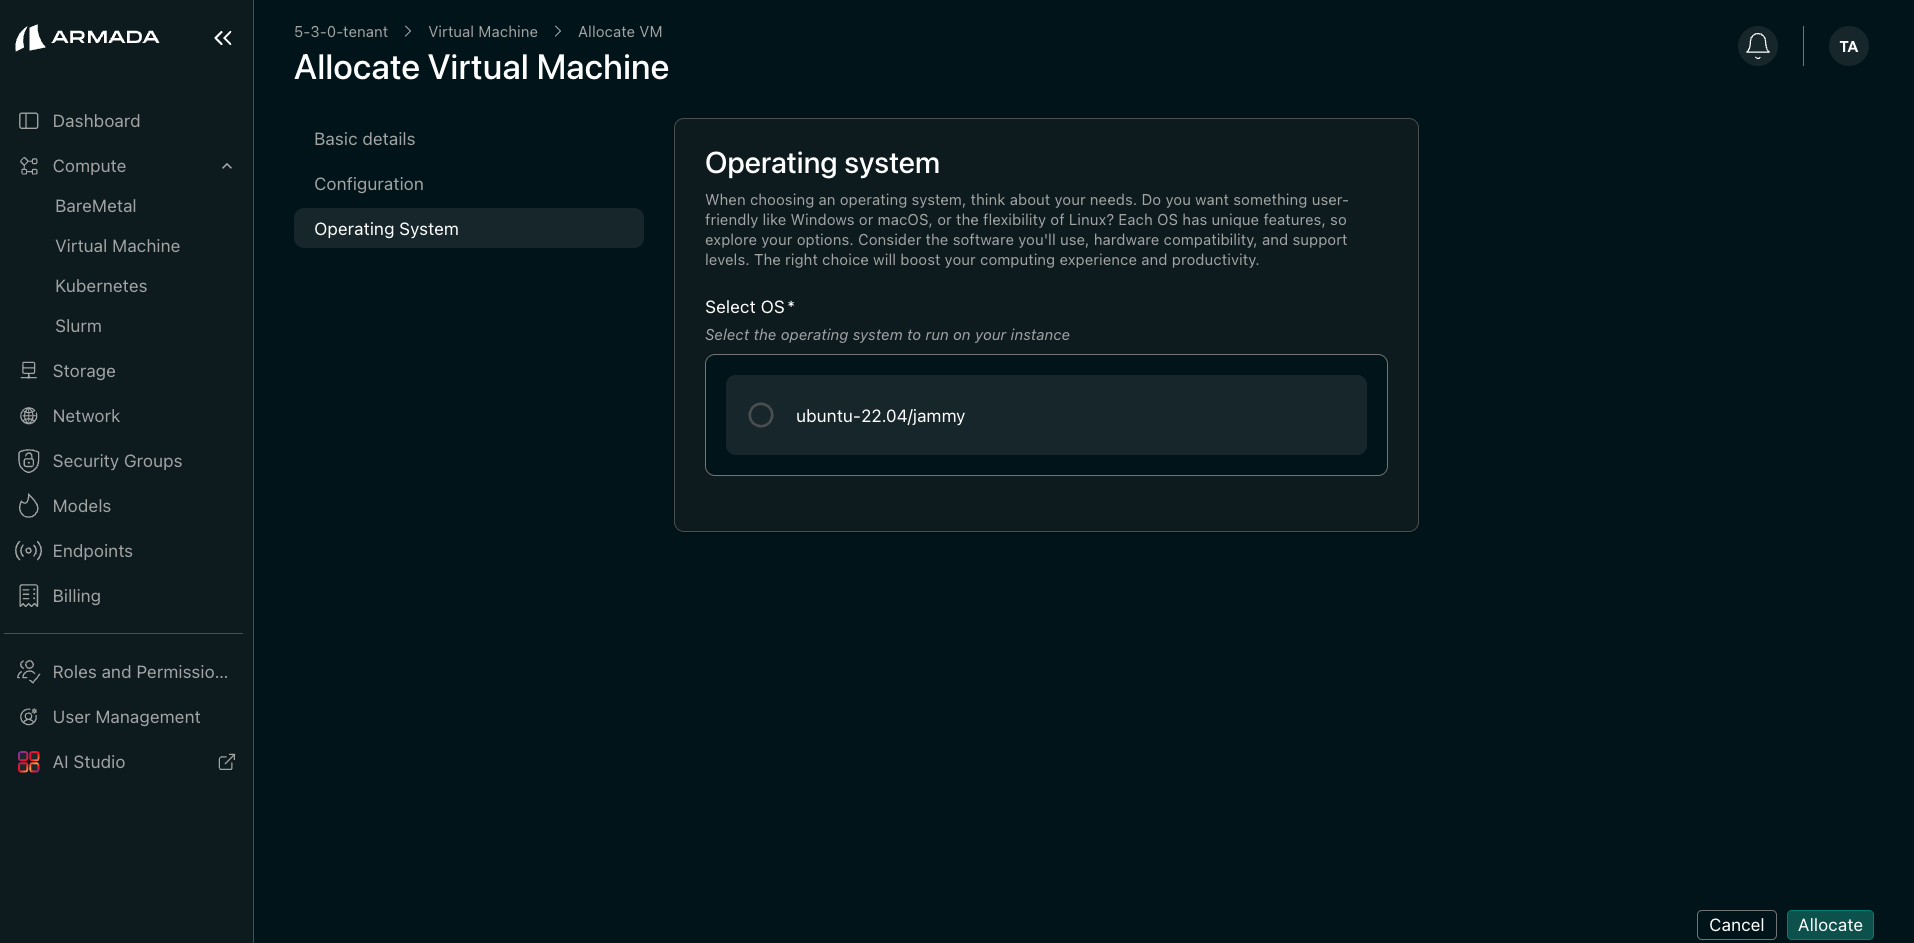
Step 4: Select OS and allocate
- Select the Operating System image.
- Click Allocate.
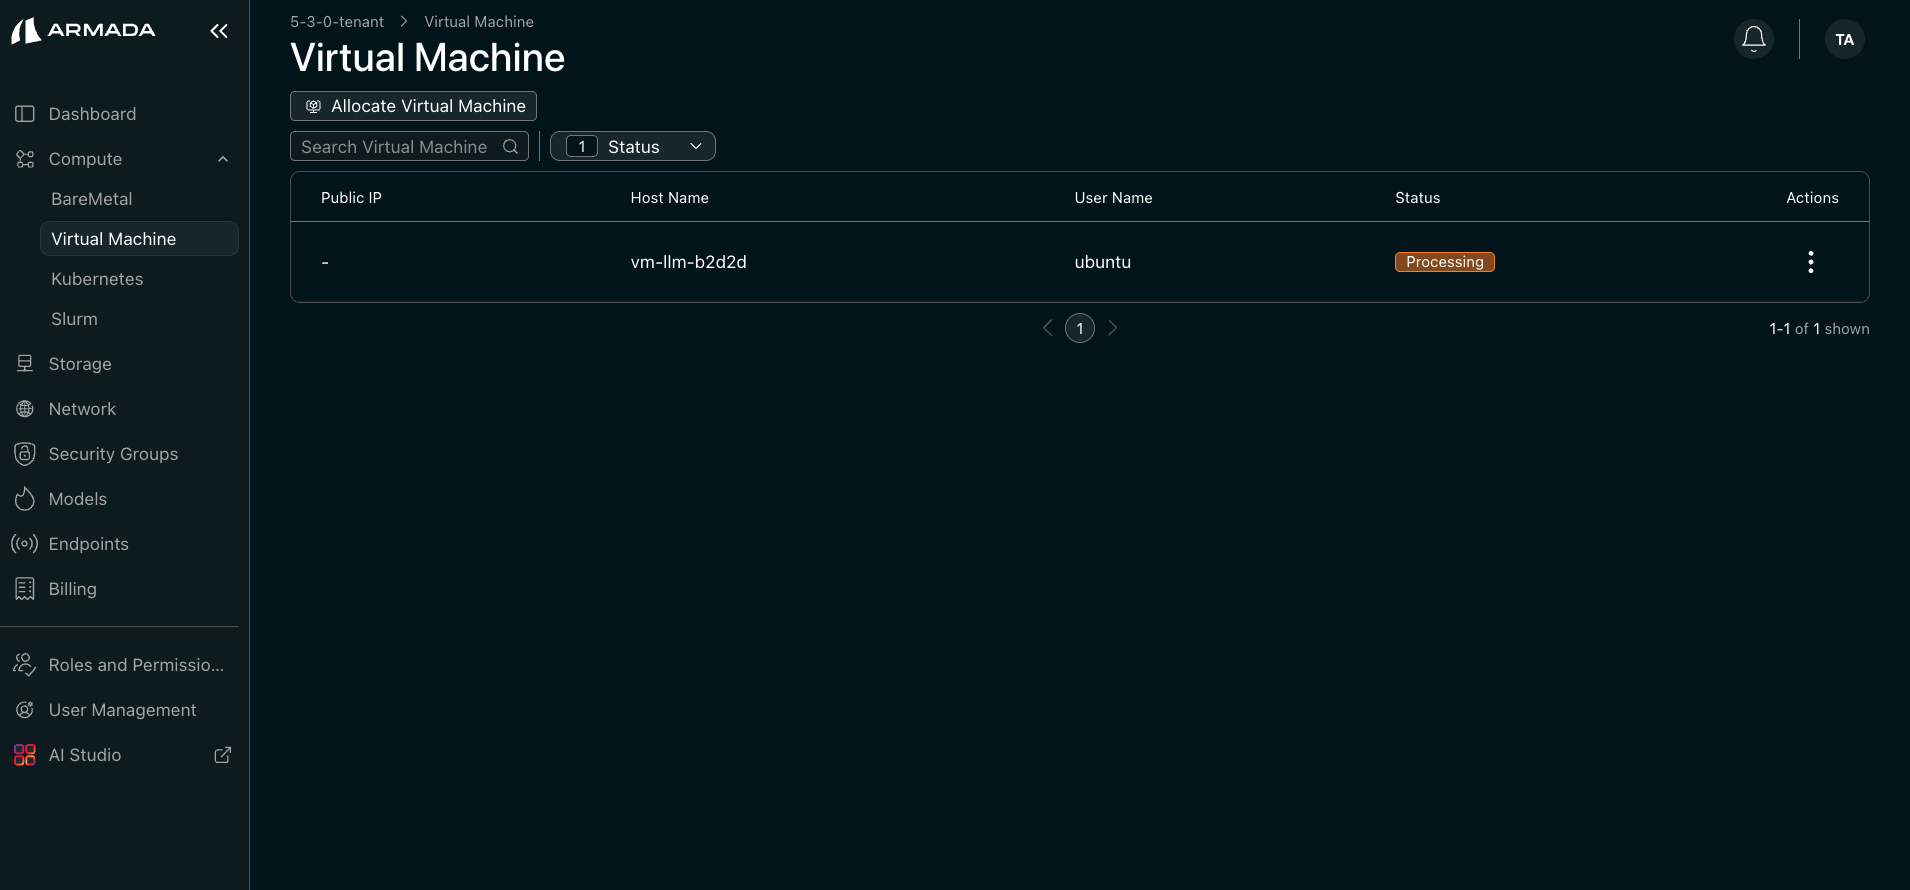
Step 5: Verify VM provisioning
- Confirm the VM appears in the list with status Processing.
- Wait until the status changes to Running. Provisioning may take several minutes.
Manage Your Virtual Machine
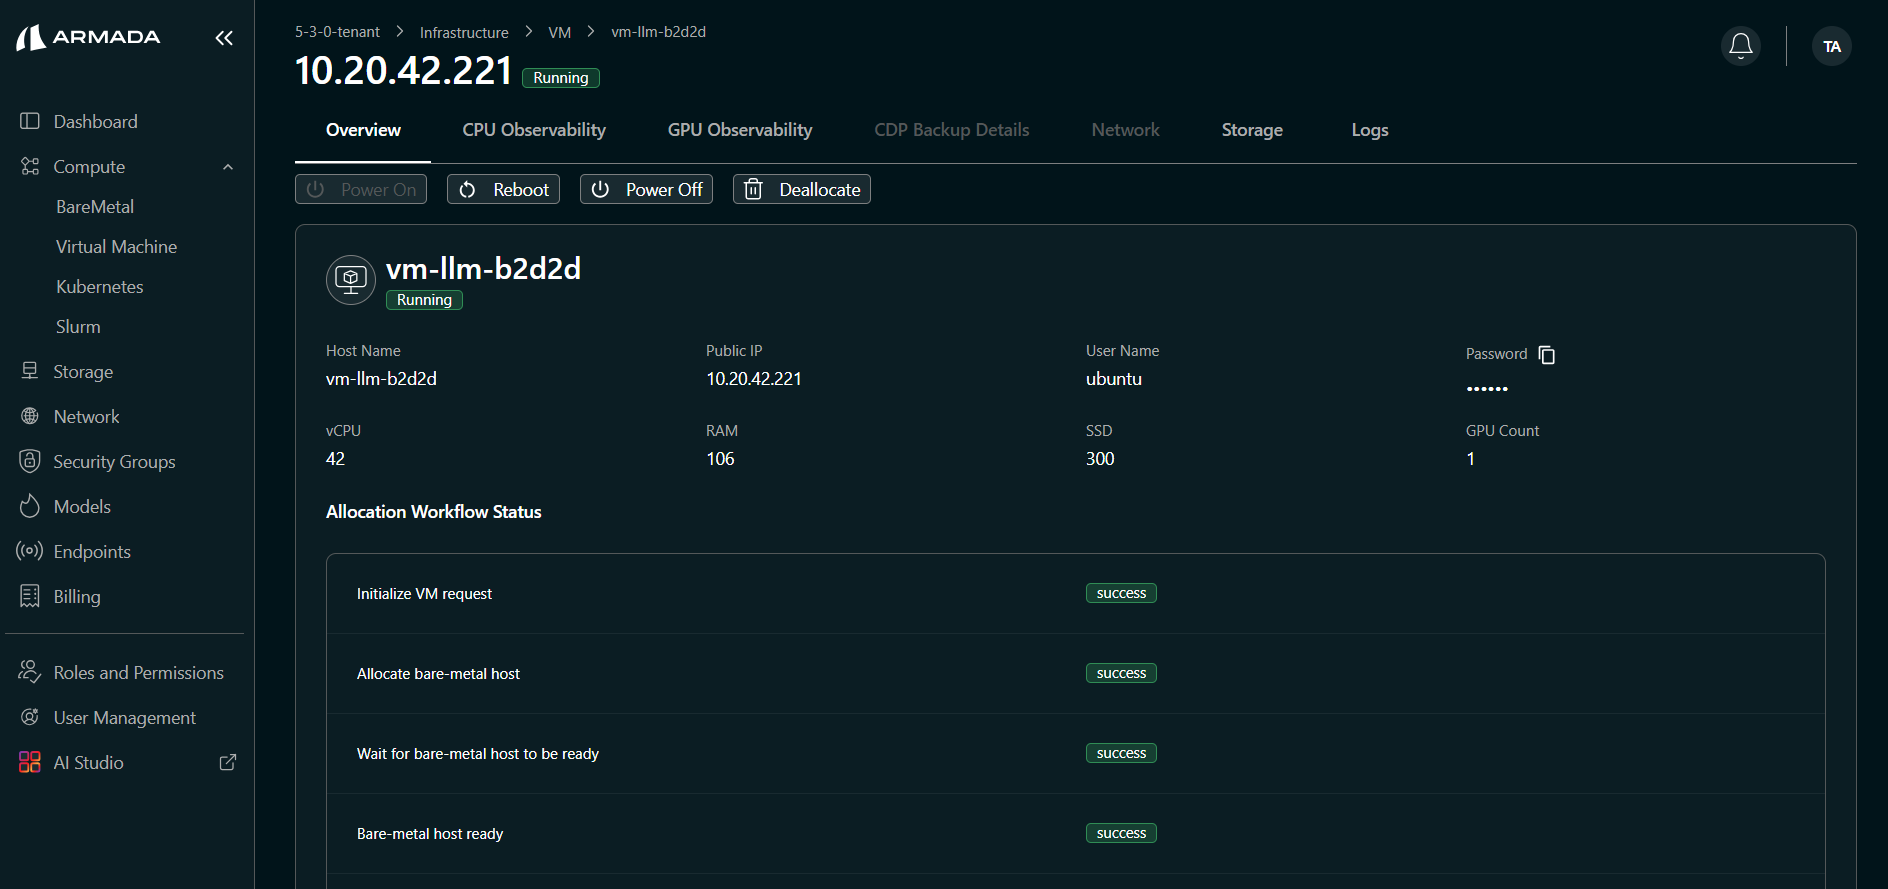
Step 1: Open VM details
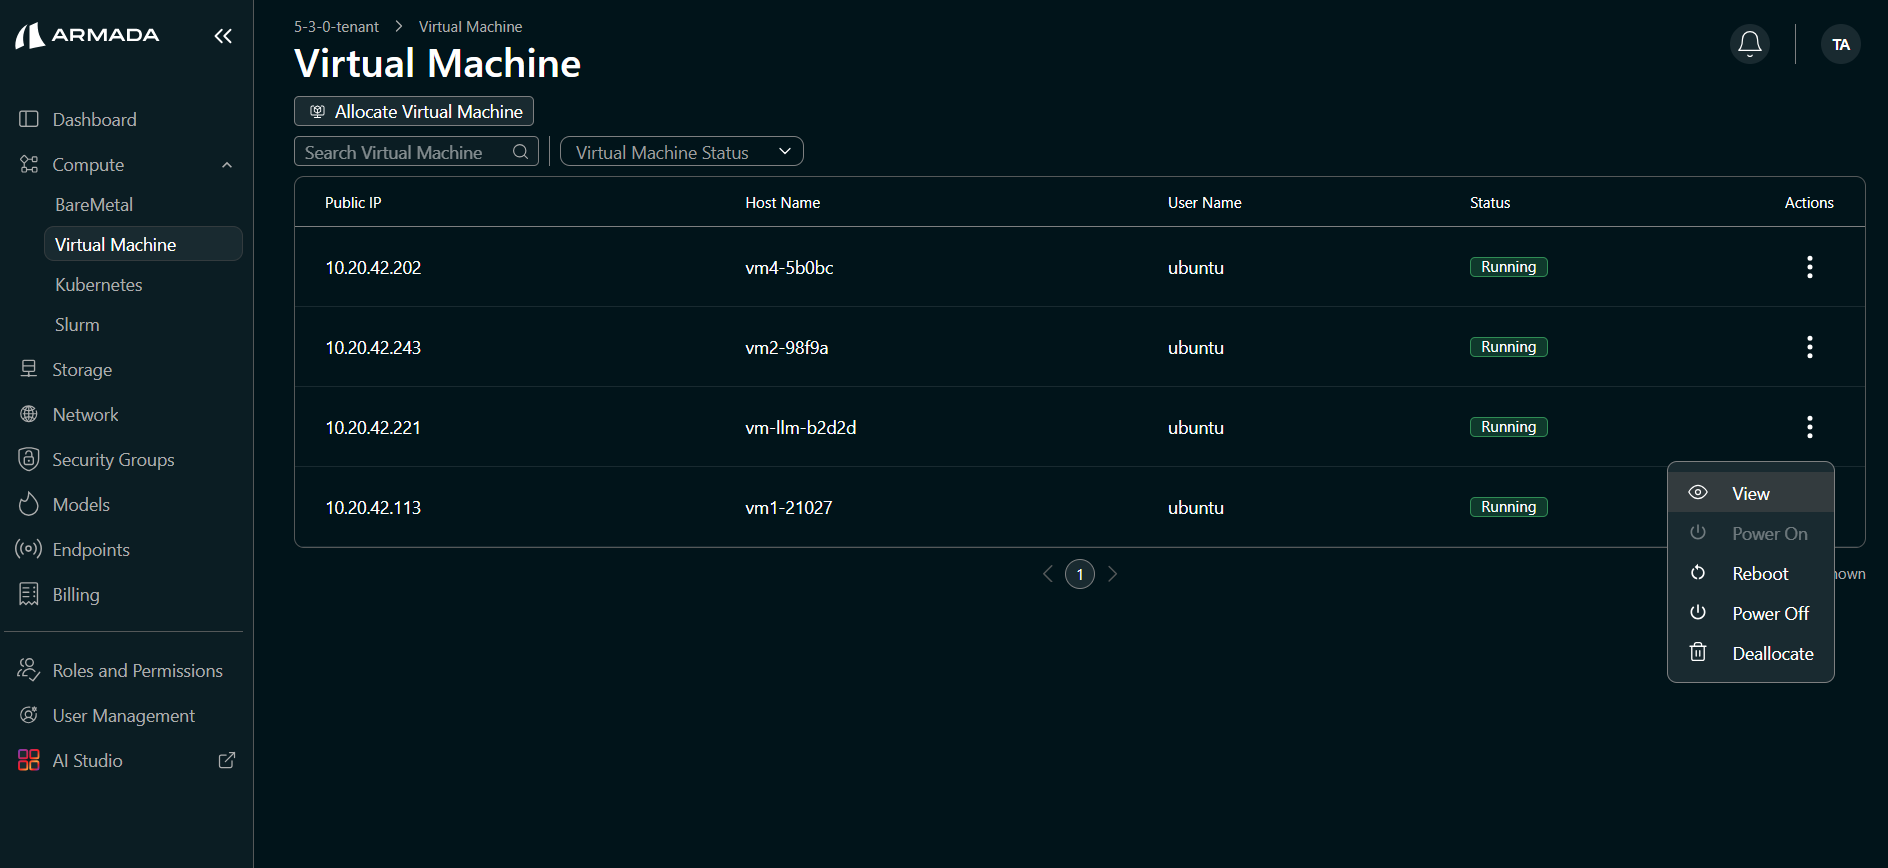
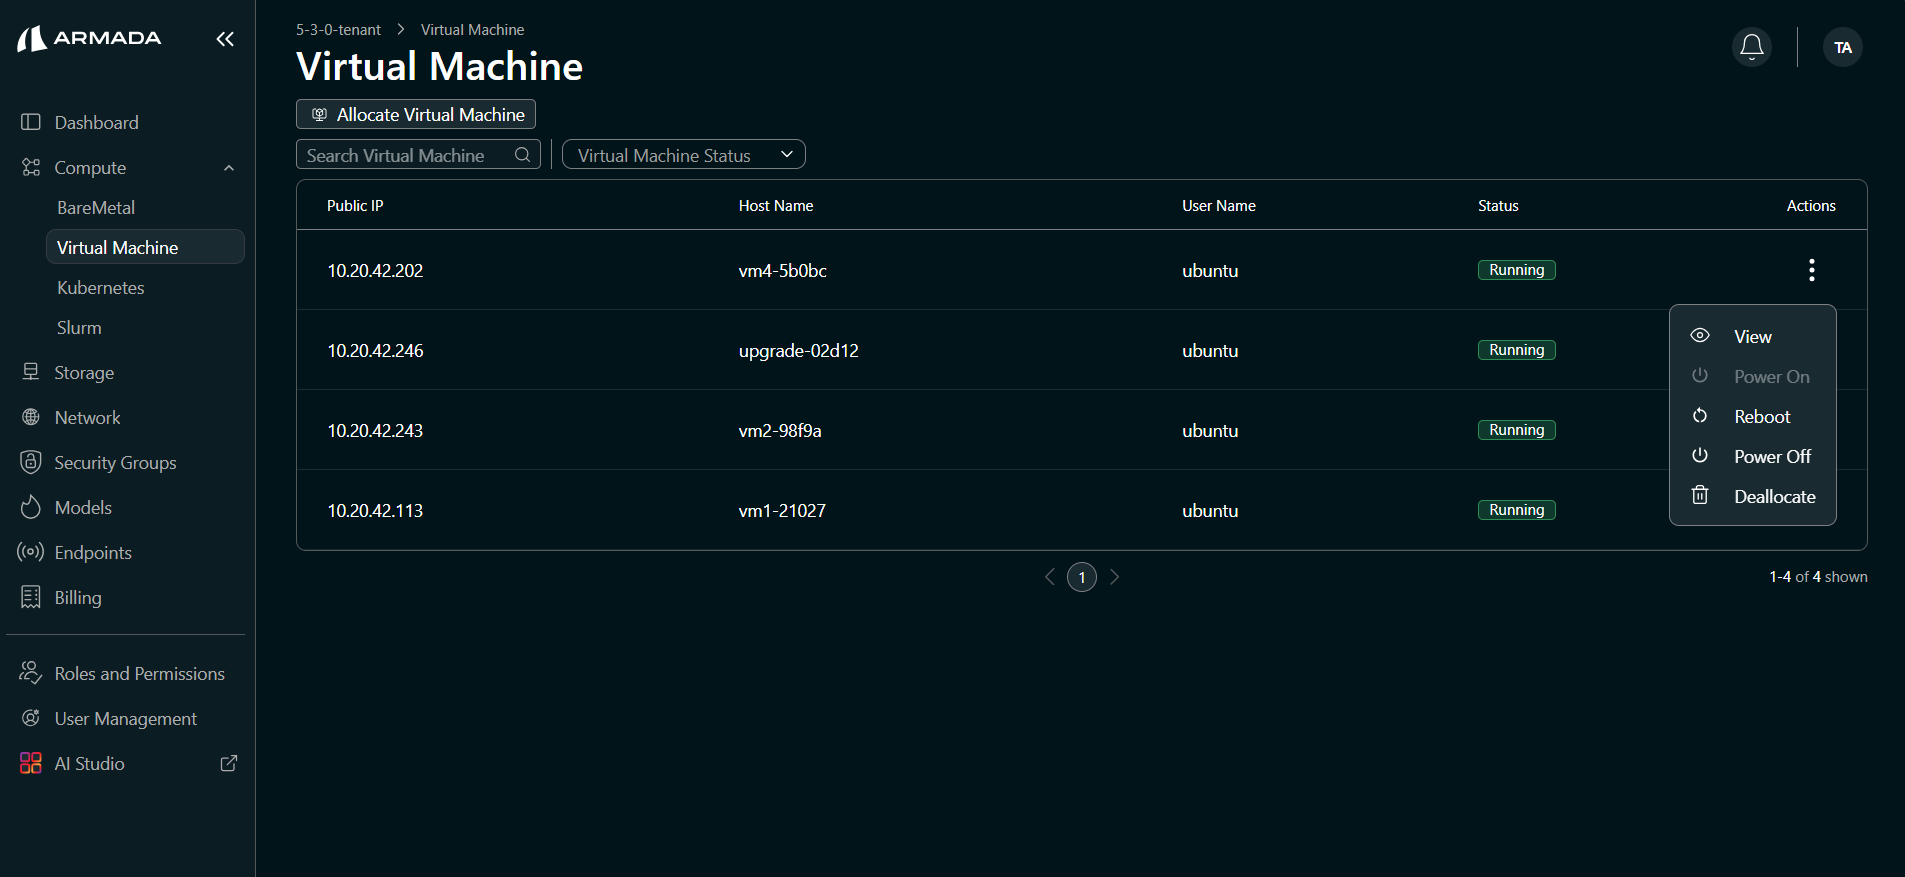
- In the Virtual Machine list, click the VM name or the ellipsis (three-dot) menu on the row and choose View.
- In the Overview tab, review:
- Hostname, public IP, username, and password
- vCPU, RAM, SSD, and GPU count
- Workflow status
Use the username and public IP shown in the Overview tab to log in to the VM with the password or the SSH key you provided during allocation.
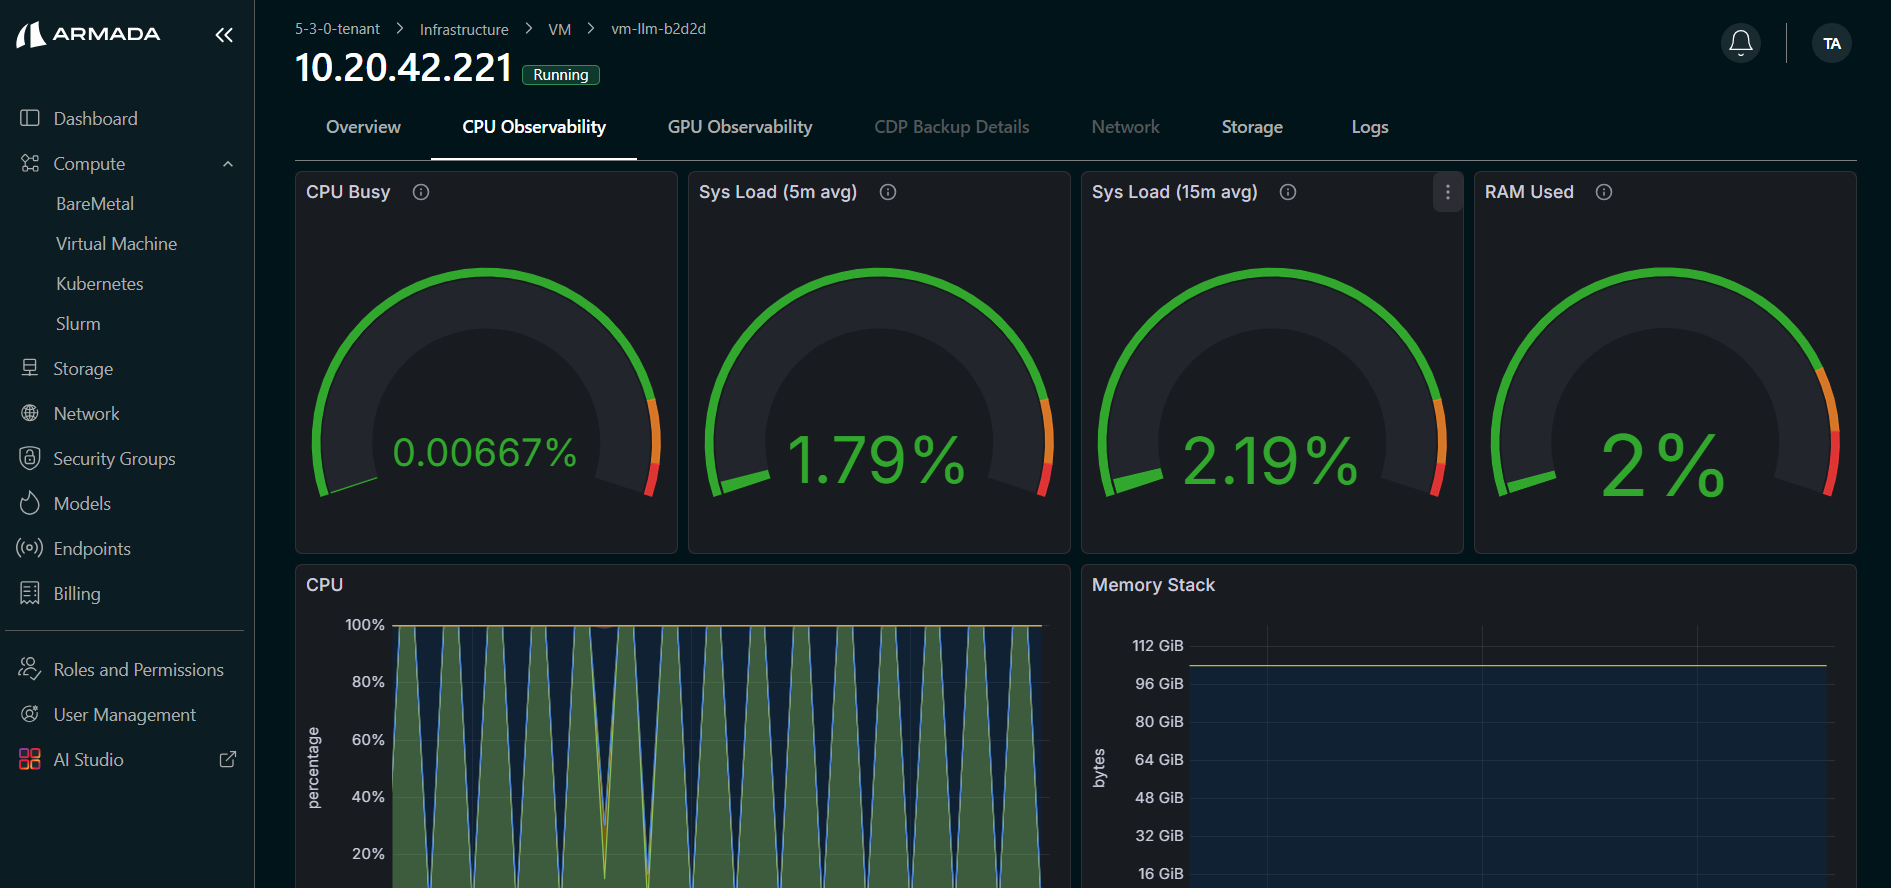
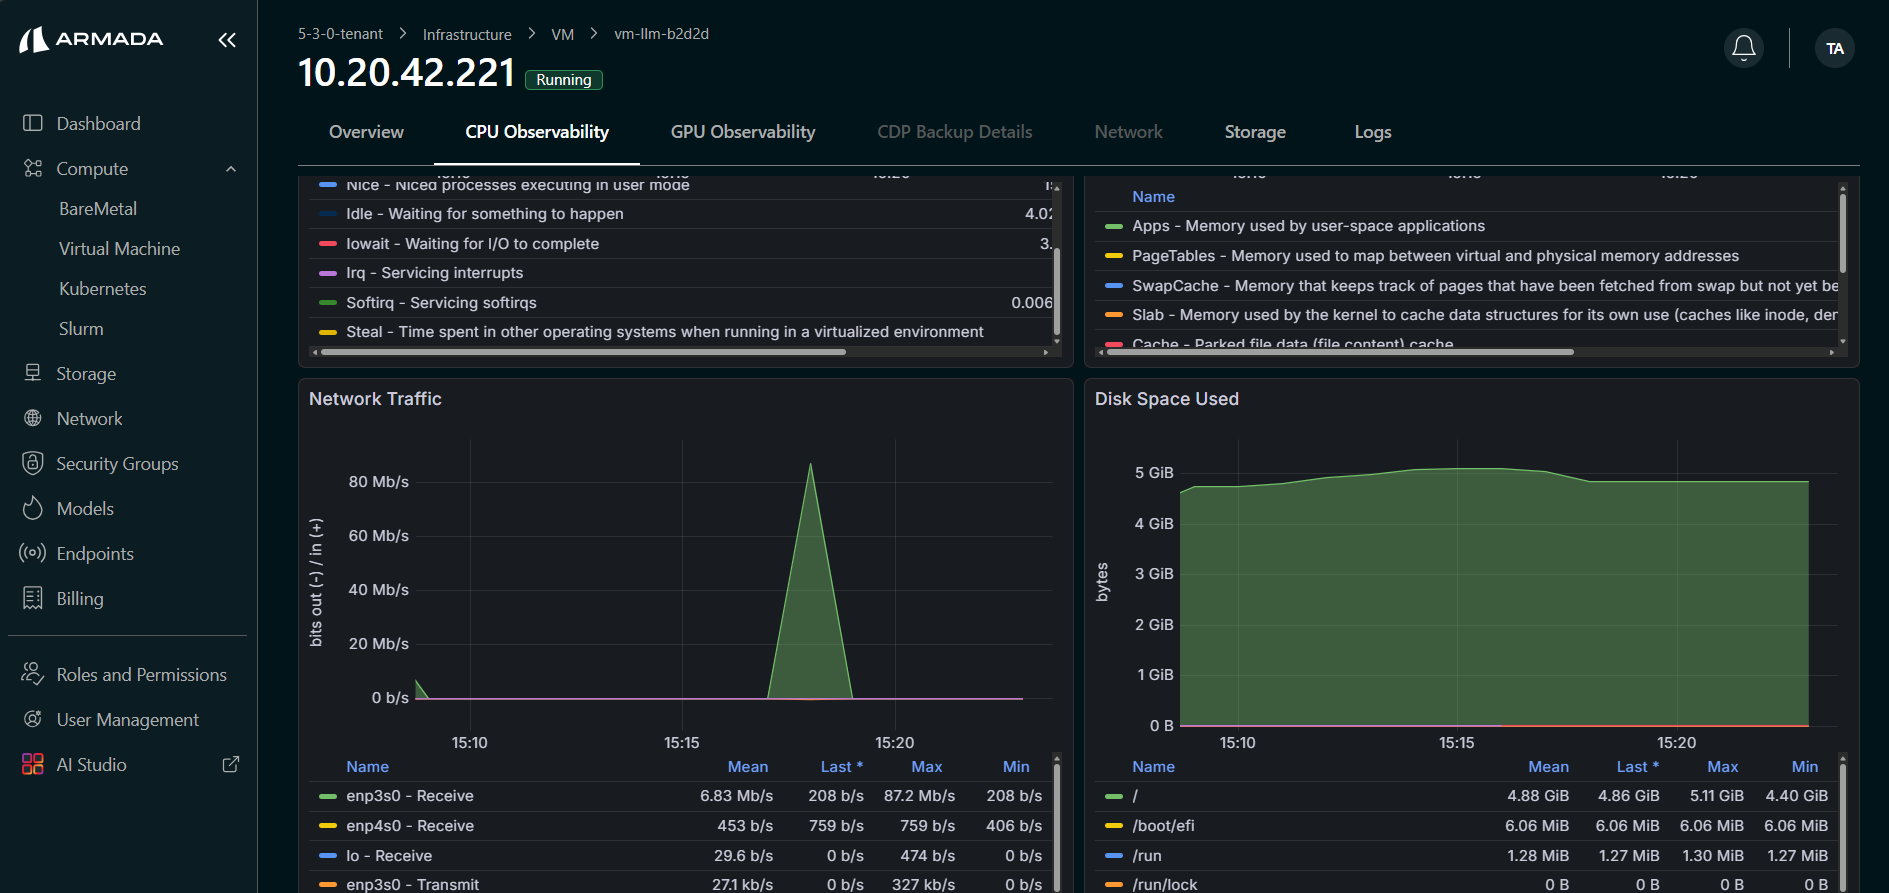
Step 2: Review CPU observability
- Open the CPU Observability tab.
- Review real-time metrics: CPU Busy, System Load, RAM Usage, CPU Utilization, Memory, Network Traffic, and Disk usage.
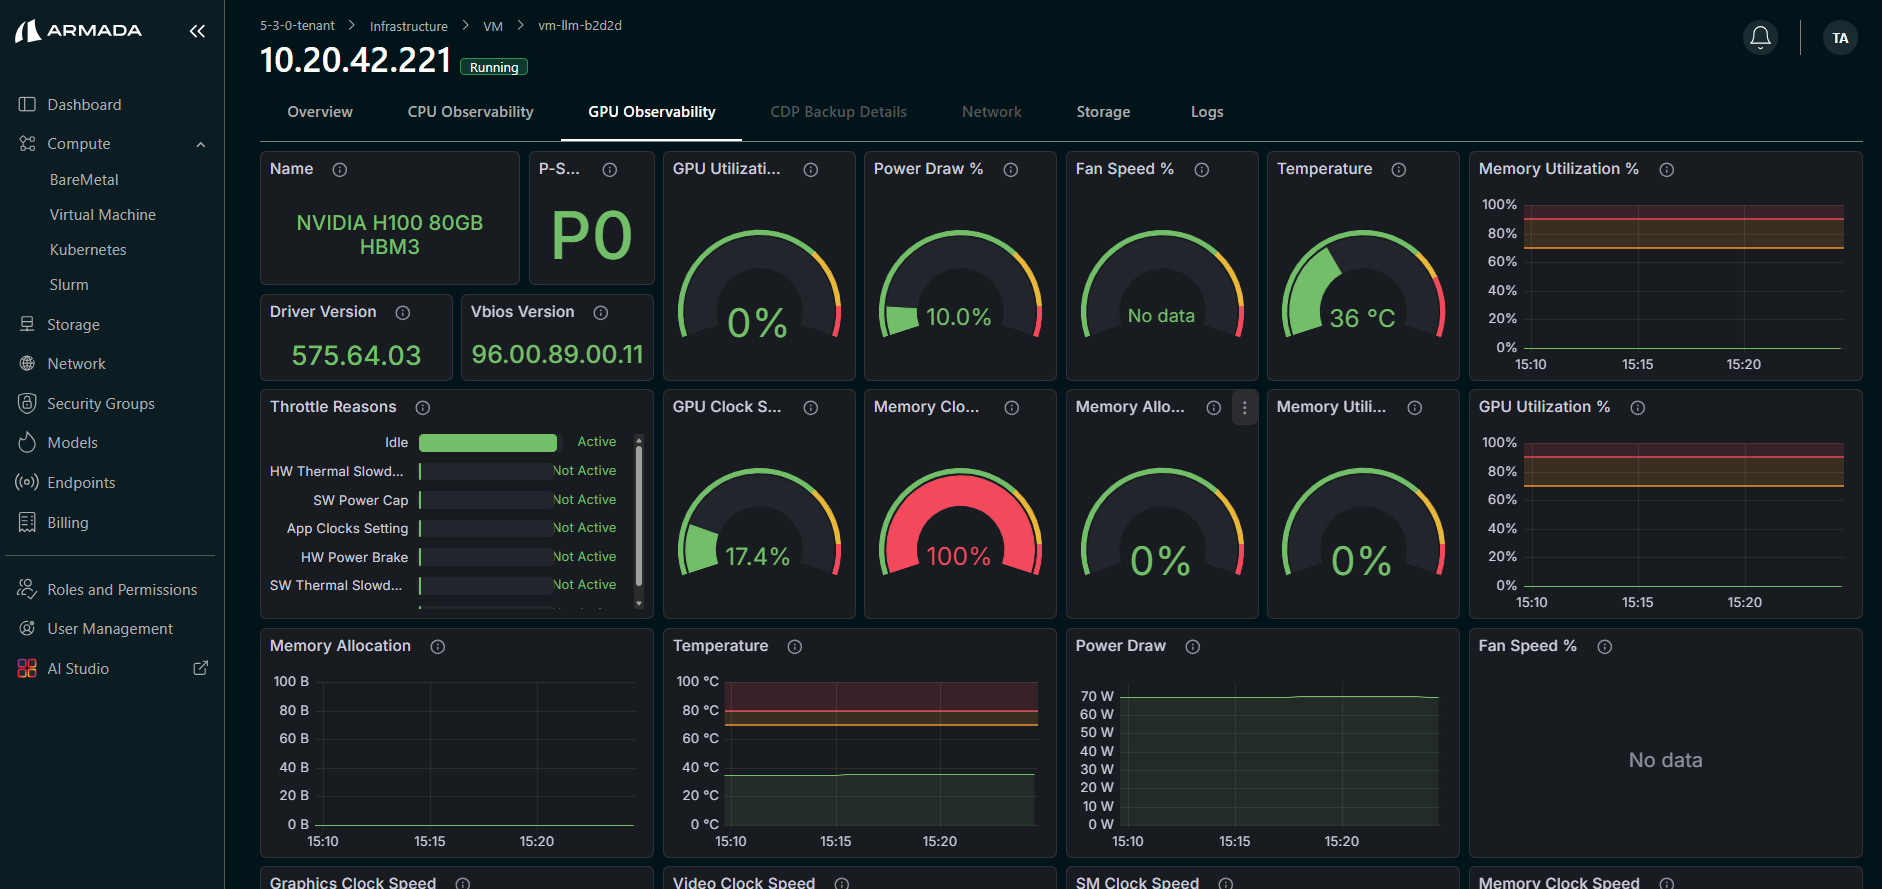
Step 3: Review GPU observability
- Open the GPU Observability tab.
- Review real-time GPU metrics: utilization, power draw, clock speeds, memory usage, temperature, and fan speed.
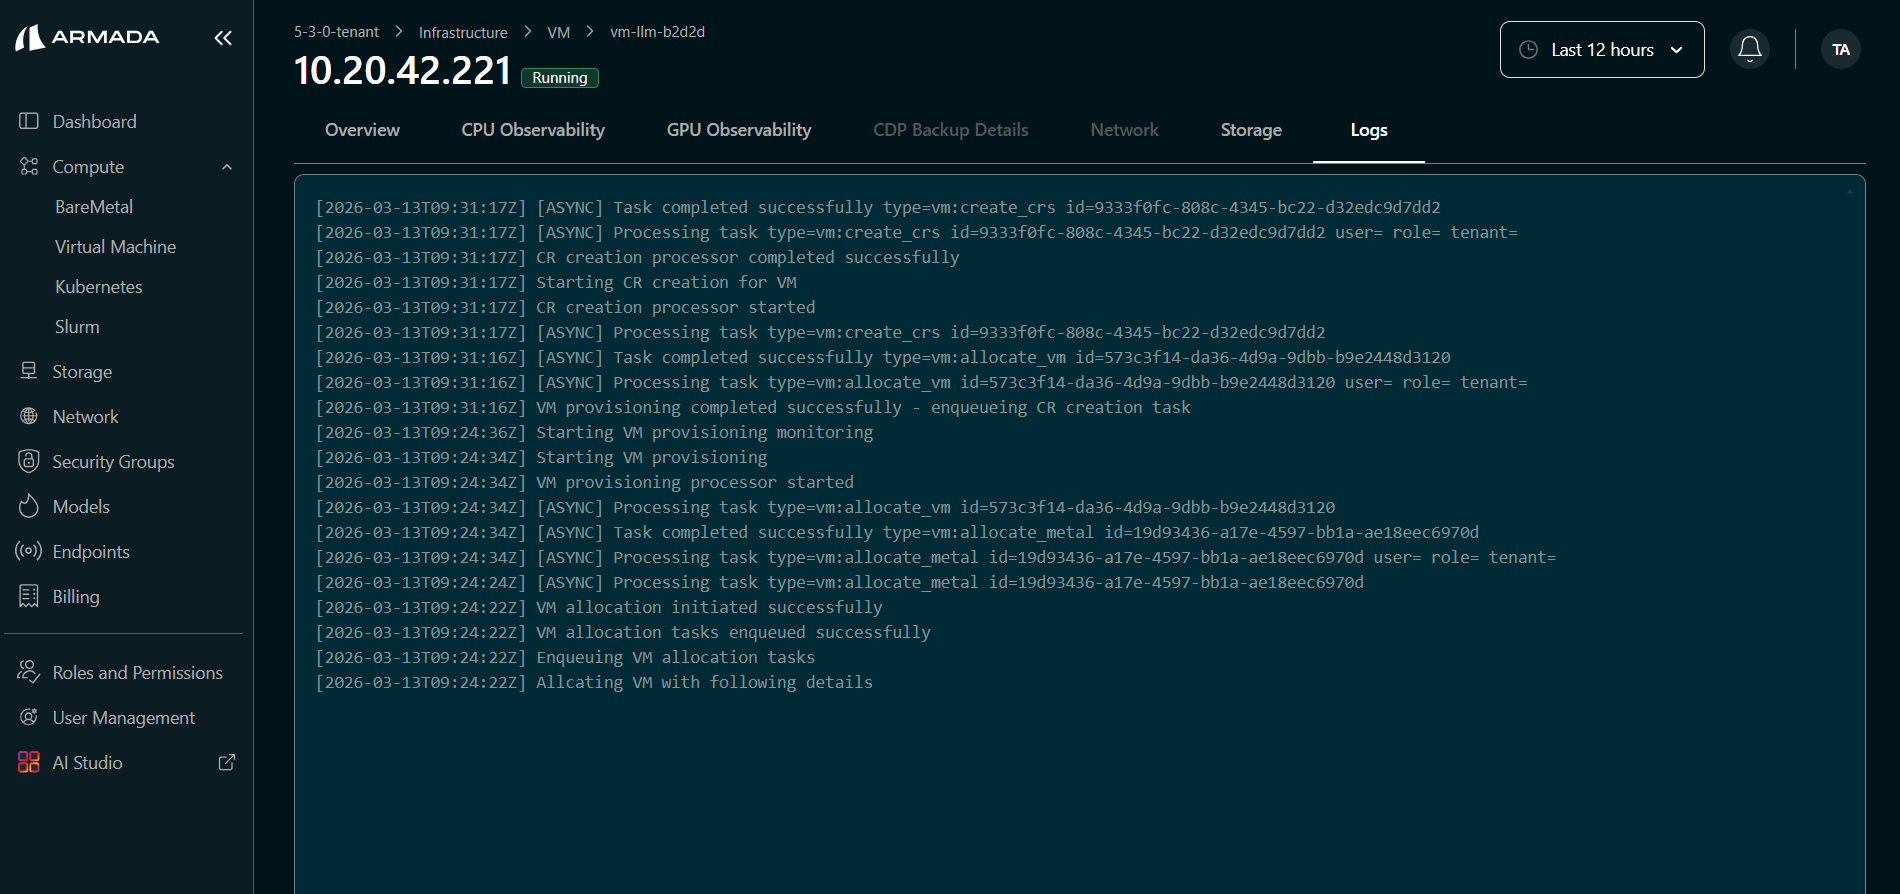
Step 4: View provisioning logs
- Open the Logs tab.
- Review the VM provisioning logs if needed for troubleshooting.
Step 5: Use power actions
- From the VM list, clicking the ellipsis menu.
- You can Reboot, Power off, or Power on the VM as needed.
Next Steps
- Kubernetes clusters — Create and manage Kubernetes clusters.
- Slurm clusters — Allocate and use Slurm compute clusters.