Dashboard
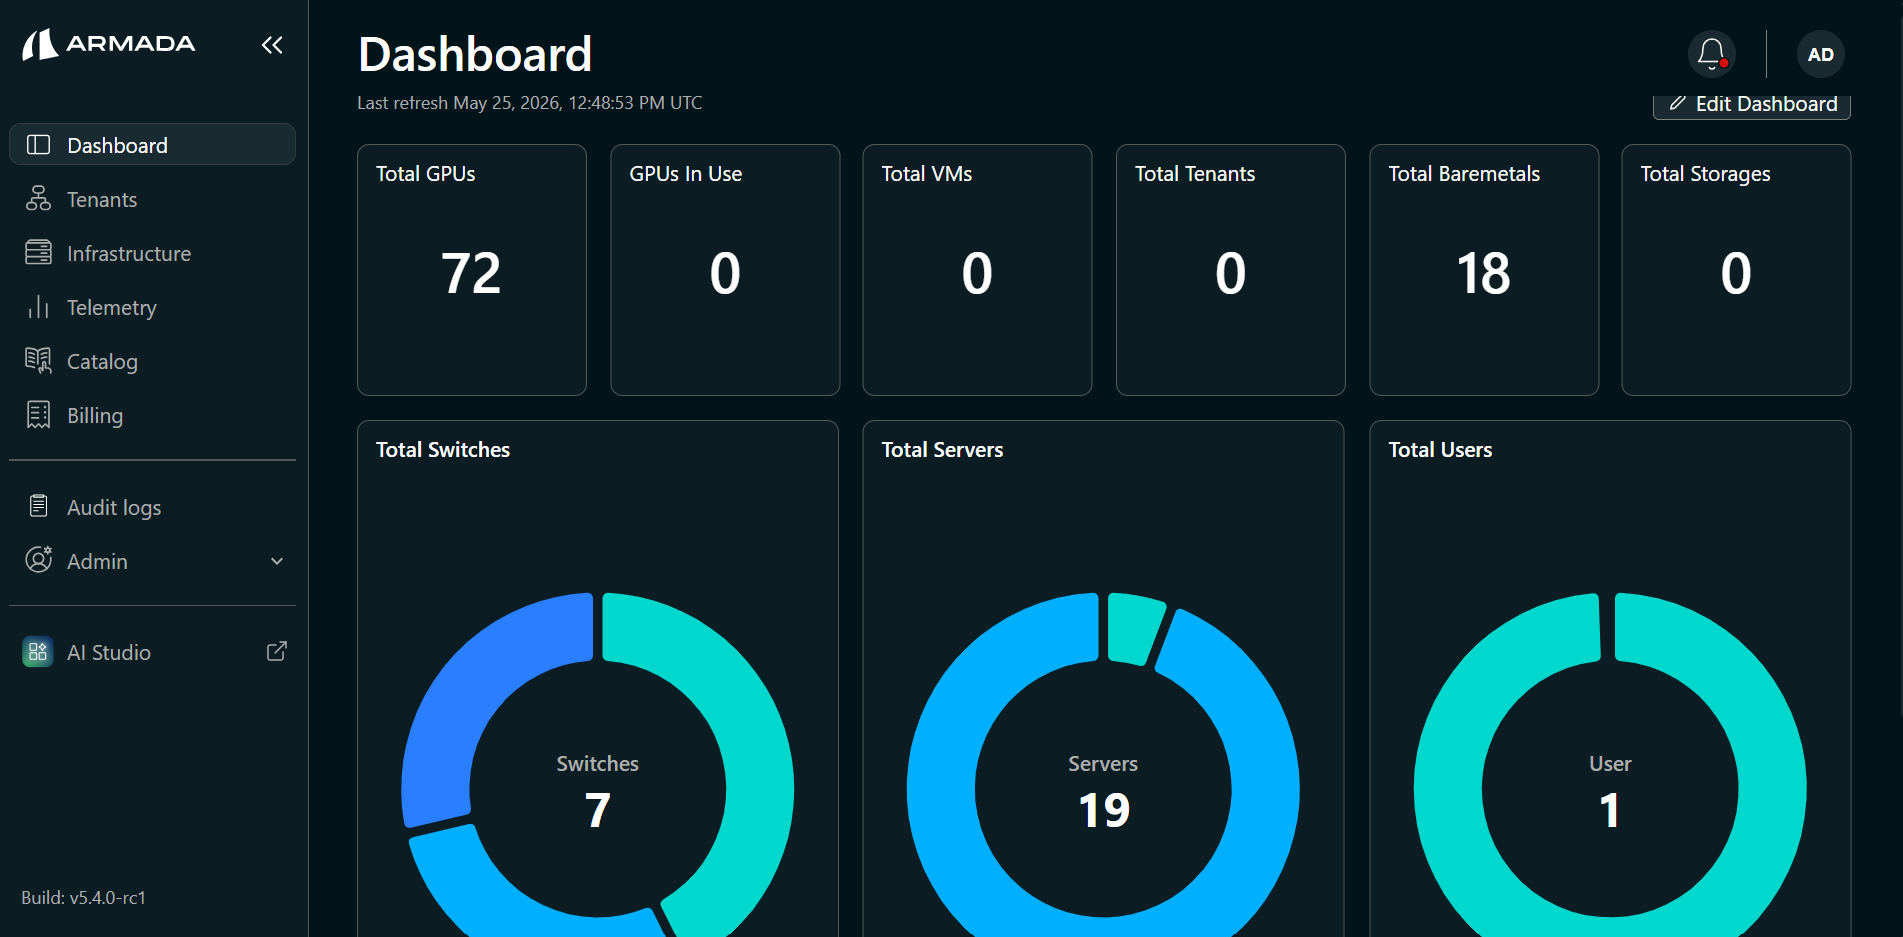
The Dashboard provides a real-time summary of the entire infrastructure managed by Bridge. It is the primary starting point for the NCP Admin to assess capacity and resource utilization.
Metrics Displayed
The dashboard shows summary cards in the top row and donut charts in the bottom row.
| Metric | Description |
|---|---|
| Total GPUs | Total number of GPUs across all imported servers |
| GPUs In Use | GPUs currently allocated to tenants |
| Total VMs | Total number of virtual machines provisioned |
| Total Tenants | Number of active tenants |
| Total Baremetals | Total number of bare metal servers registered in Bridge |
| Total Storages | Total storage nodes available |
| Total Switches | Total network switches discovered or imported |
| Total Servers | Total number of servers imported in Bridge |
| Total Users | Total user count across all tenants |
Dashboard States
Before infrastructure import or discovery — all counters display 0.
After import or discovery — the Dashboard reflects:
- GPU totals from imported servers
- GPUs in use based on tenant allocation
- Server and bare metal counts matching the imported inventory
- Switch counts from discovered or imported topology
- All other metrics remain at 0 until tenants and resources are provisioned
Next Steps
- Tenant Creation — Create isolated tenant environments with resource quotas and pricing configuration.