Compute Topology Discovery
This page covers the end-to-end process for discovering a compute topology — entering discovery parameters, monitoring progress, and verifying the resulting inventory.
Bridge supports two compute topology types:
- Tier 2: Spine-leaf architecture — provide spine switch MAC addresses
- Tier 3: Three-tier architecture (core + spine + leaf) — provide core switch MAC addresses
Discovery Process
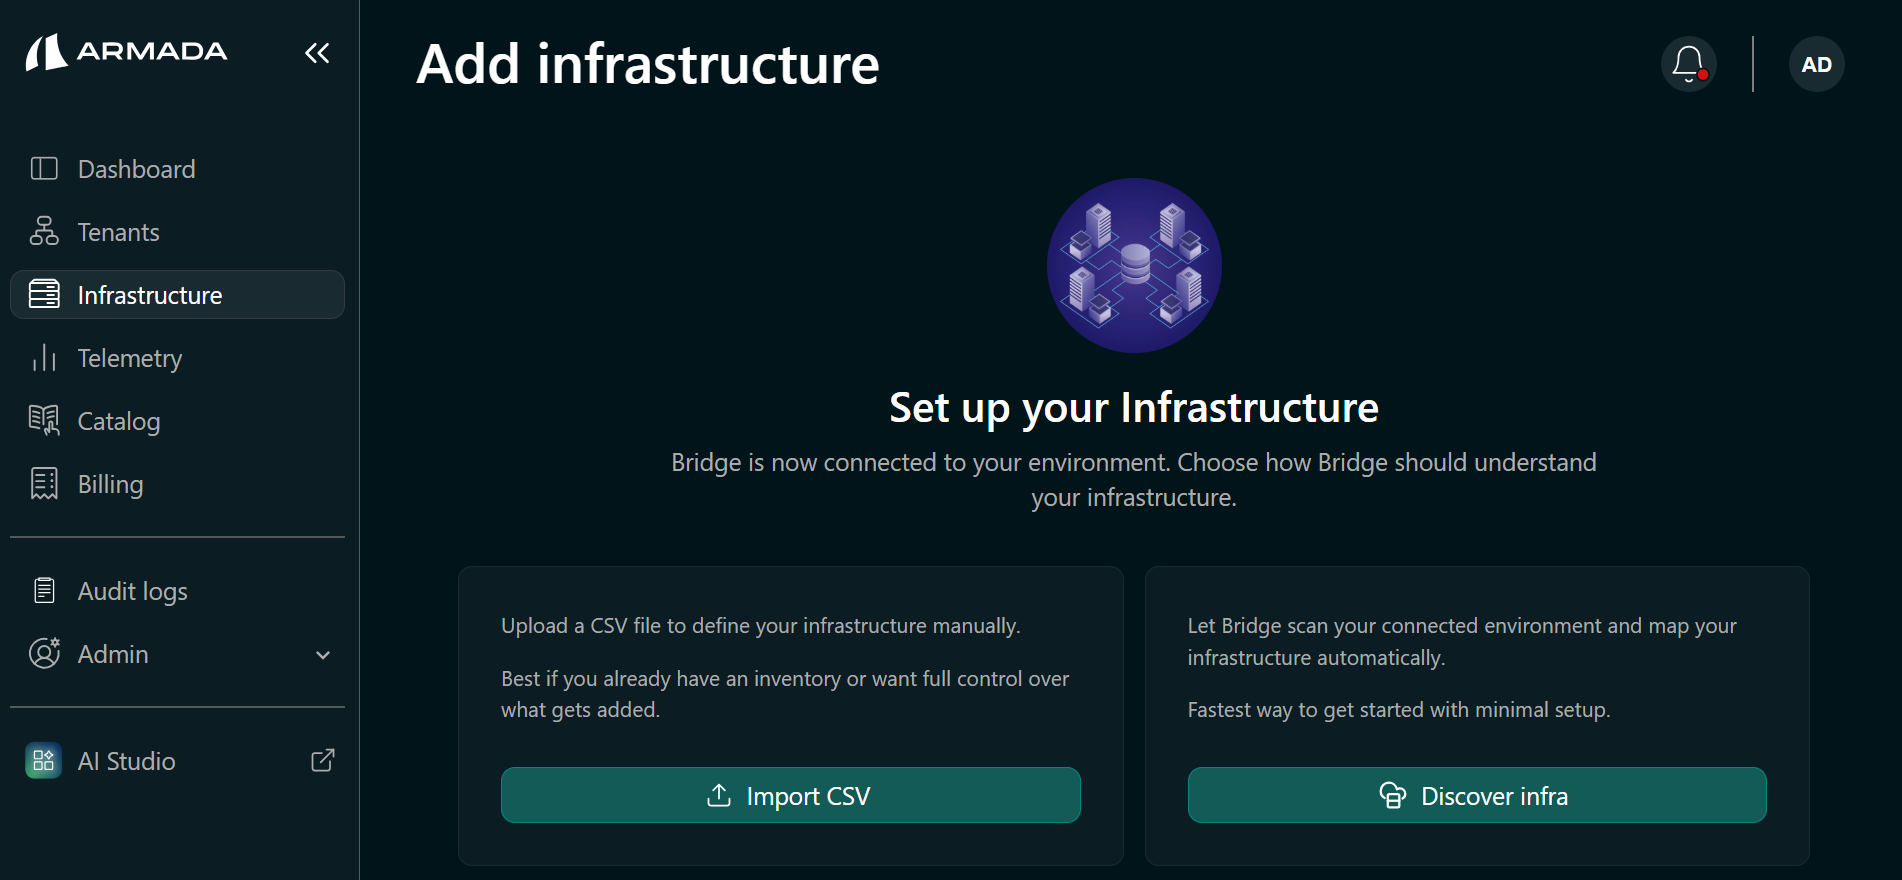
Step 1: Start Discovery
Navigate to Infrastructure in the sidebar and Click Discover Infra.
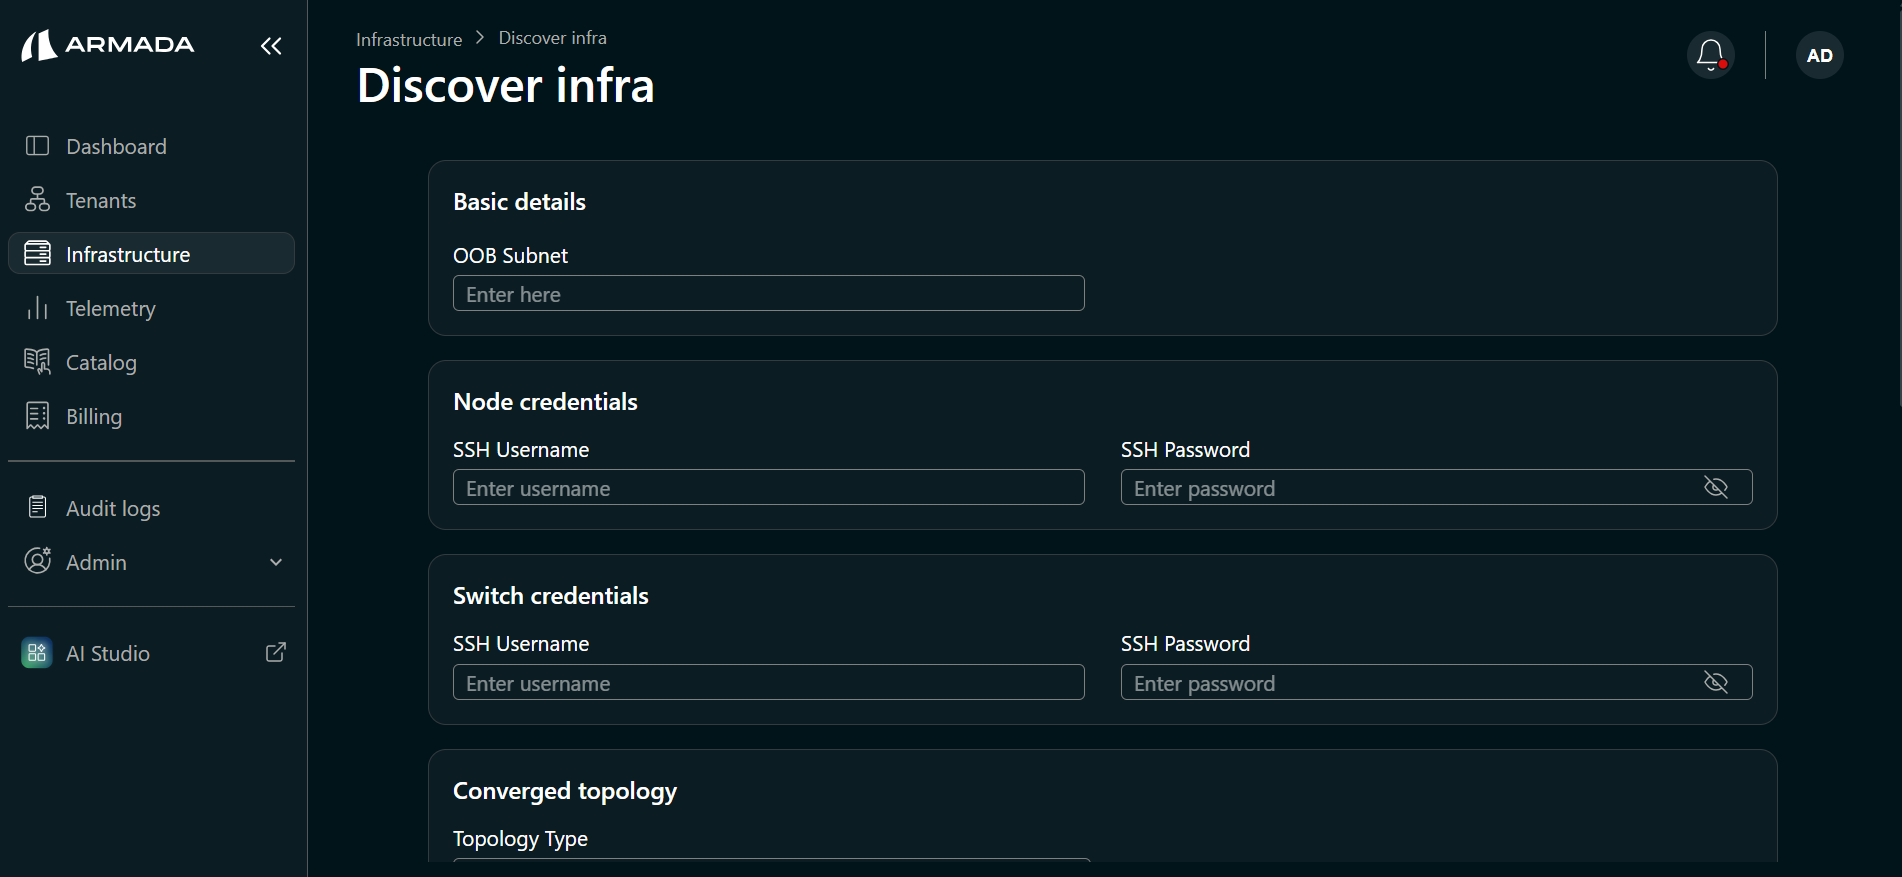
Step 2: Enter OOB and Credentials
In the pop-up window, provide:
- OOB Subnet: The out-of-band management subnet
- Node(Compute) and Switch Credentials: SSH Username and Password
Step 3: Configure Storage Topology
Provide the storage topology information:
| Field | Value |
|---|---|
| Topology Type | Tier 1 |
| Vendor | native |
| IP | Storage node IP |
| Username | ubuntu |
| Password | nvidia |
Also enter the Storage Leaf Switch MAC Address (storage-leaf-0).
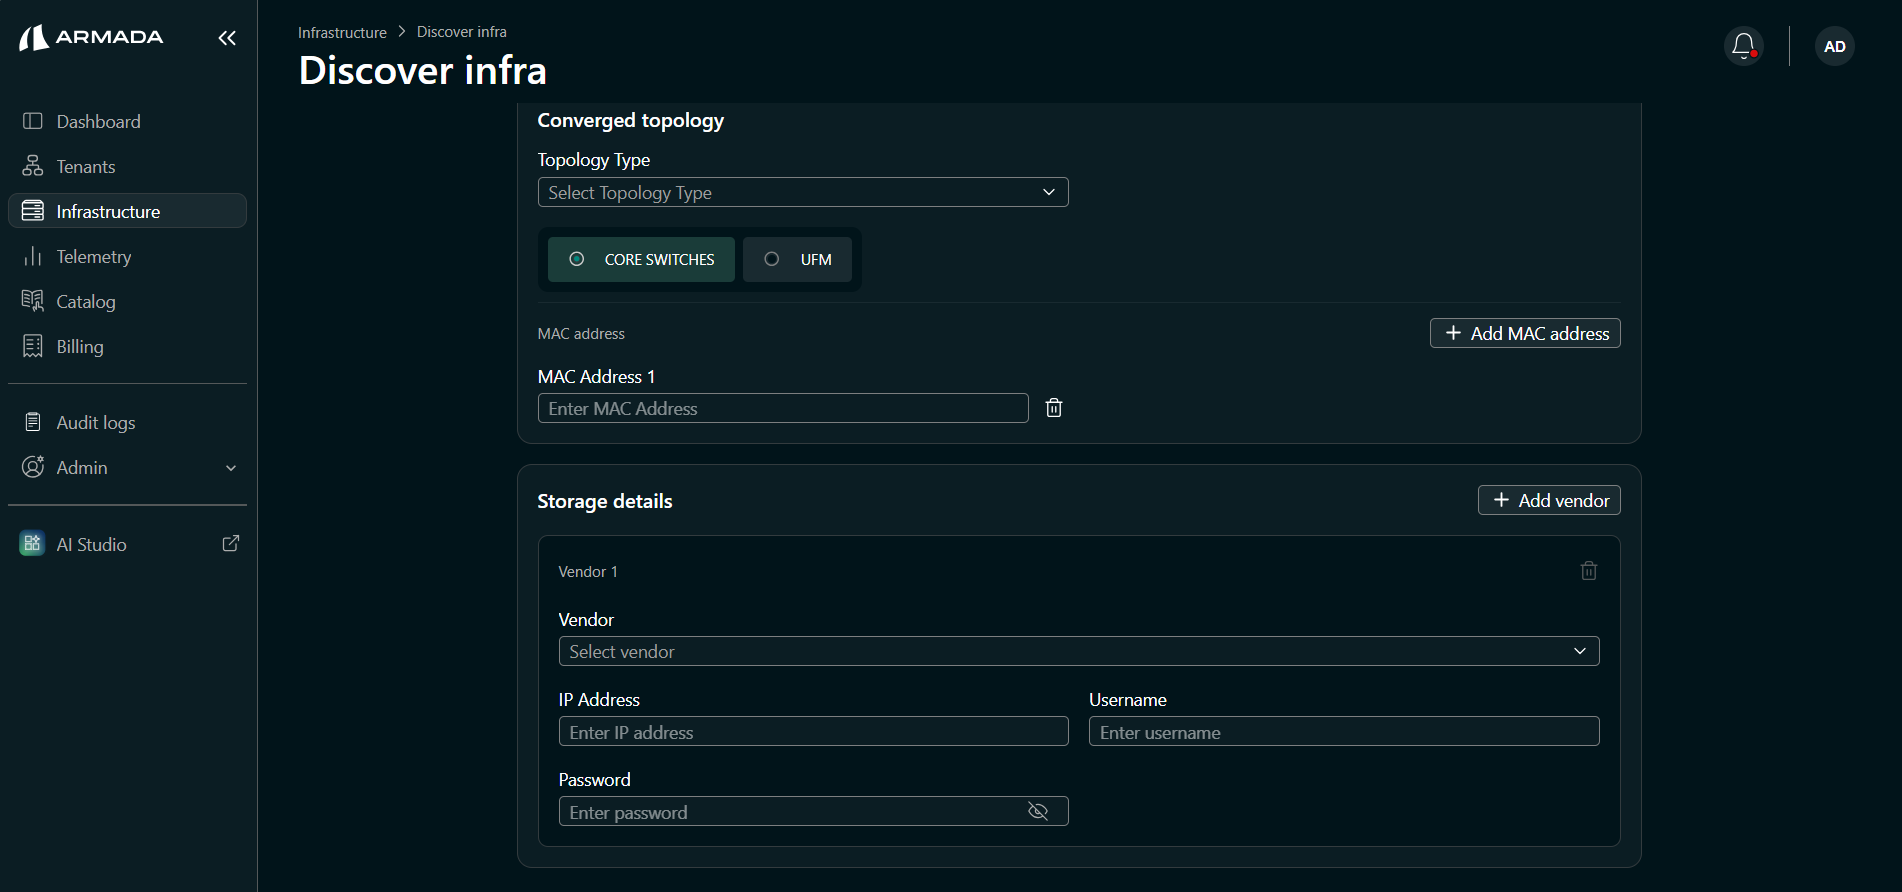
Step 4: Configure Compute Topology
Select the Compute Topology Type as Tier 3 or Tier 2 based on your network topology:
- Tier 3: Enter the MAC addresses of all core switches
- Tier 2: Enter the MAC addresses of all spine switches
All core or spine switch MAC addresses must be added.
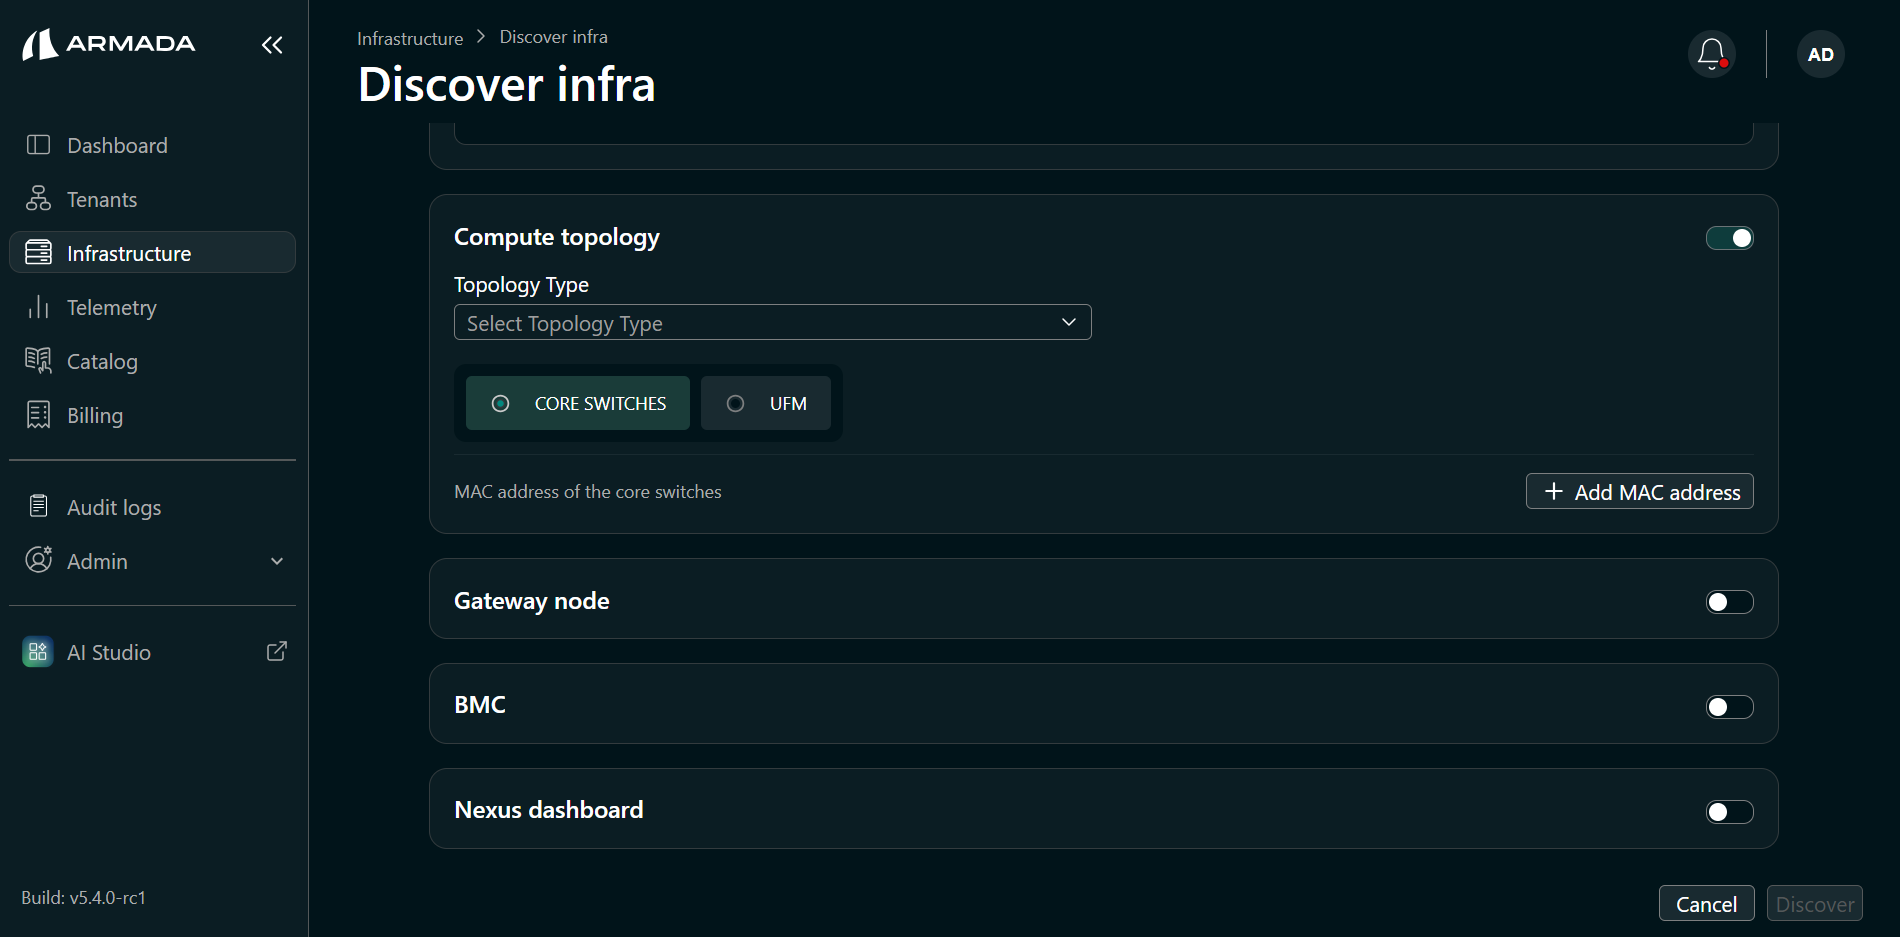
Once all details are provided for compute, storage topology, and the gateway node (if required), click Done to start topology discovery.
Bridge supports External Gateway through F5 BigIP.
Monitor Topology Discovery
The time required for discovery depends on the number of switches, compute nodes, storage devices, and their interconnections.
Monitor the in-progress topology discovery status from the Infrastructure view.
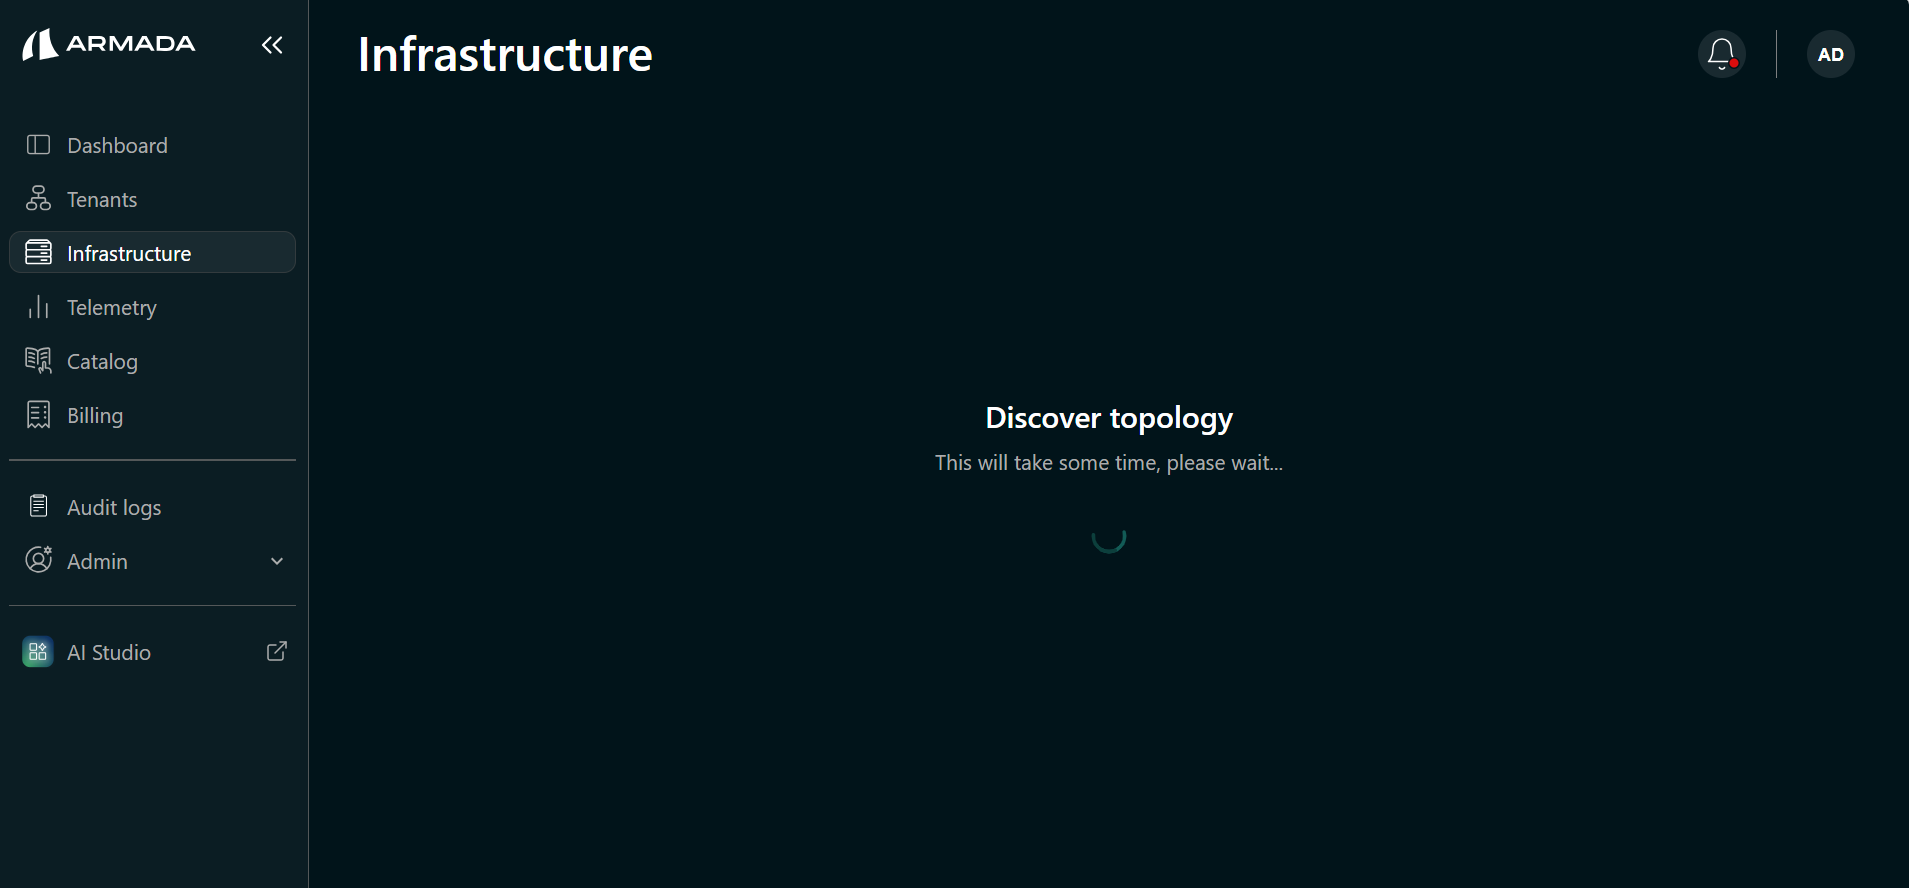
Once discovery completes successfully, the topology view is displayed.
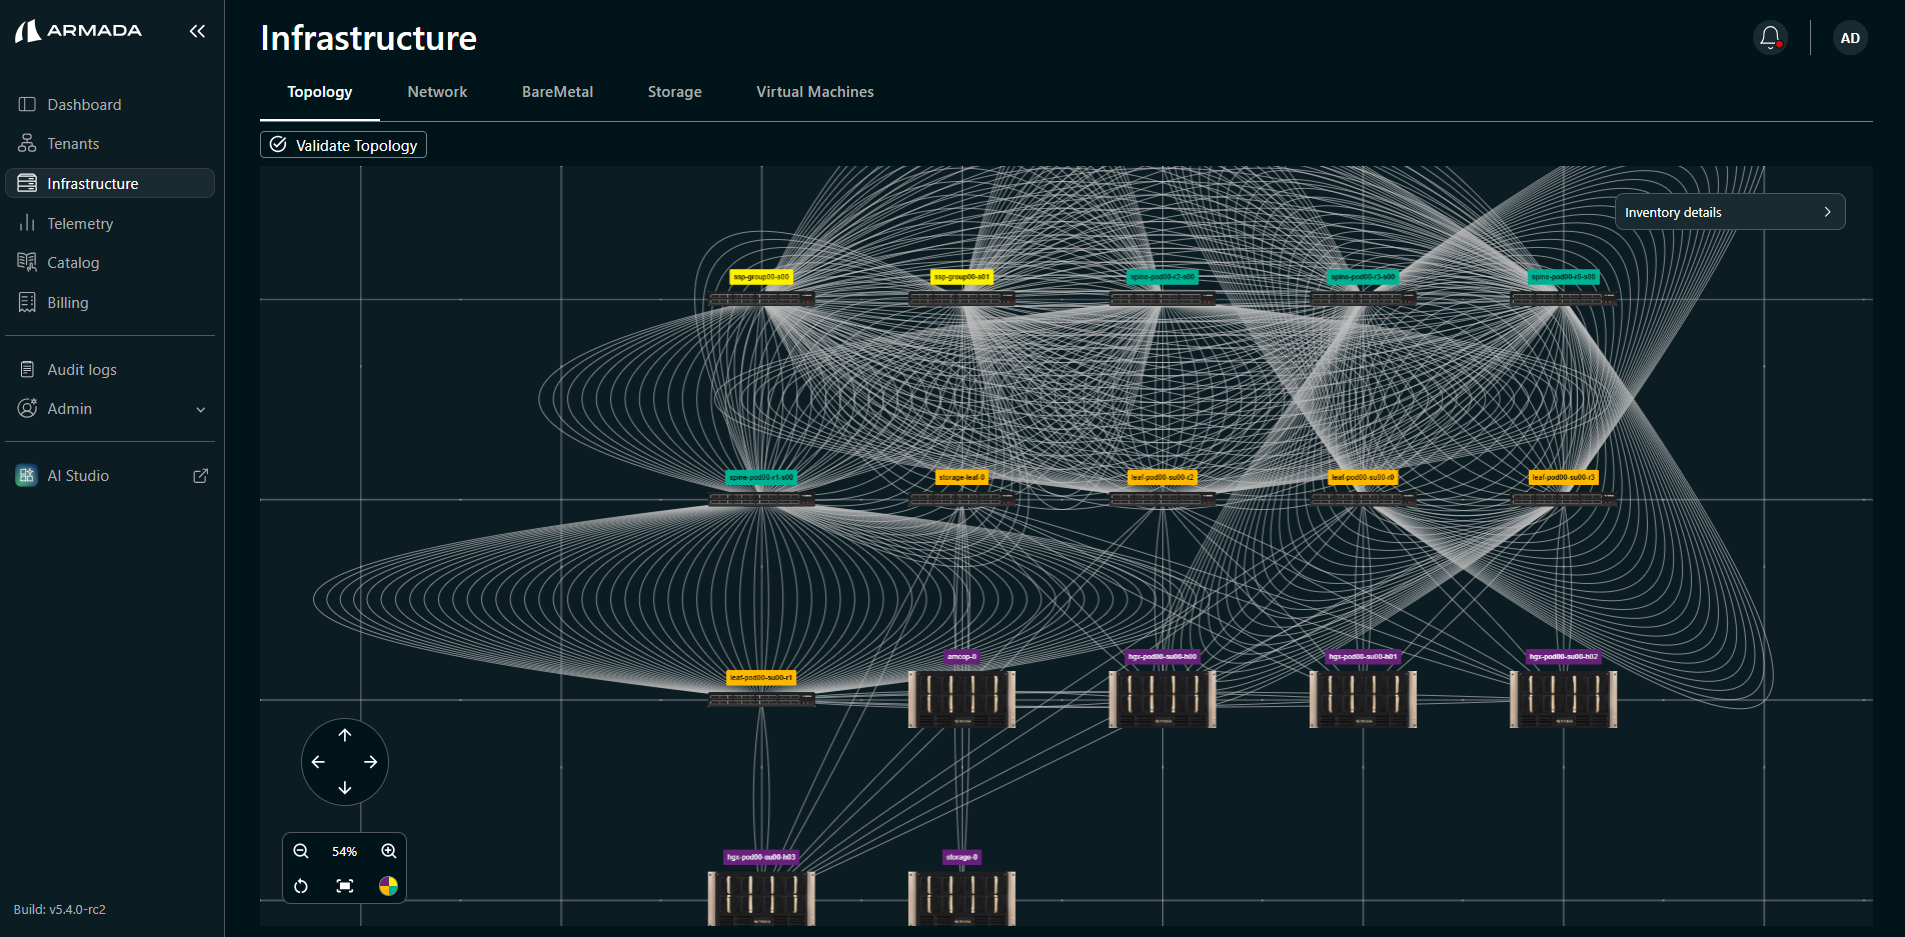
Verify Inventory Details
Switches
Click Inventory Details to view the total number of discovered switches(core, spine and leaf).
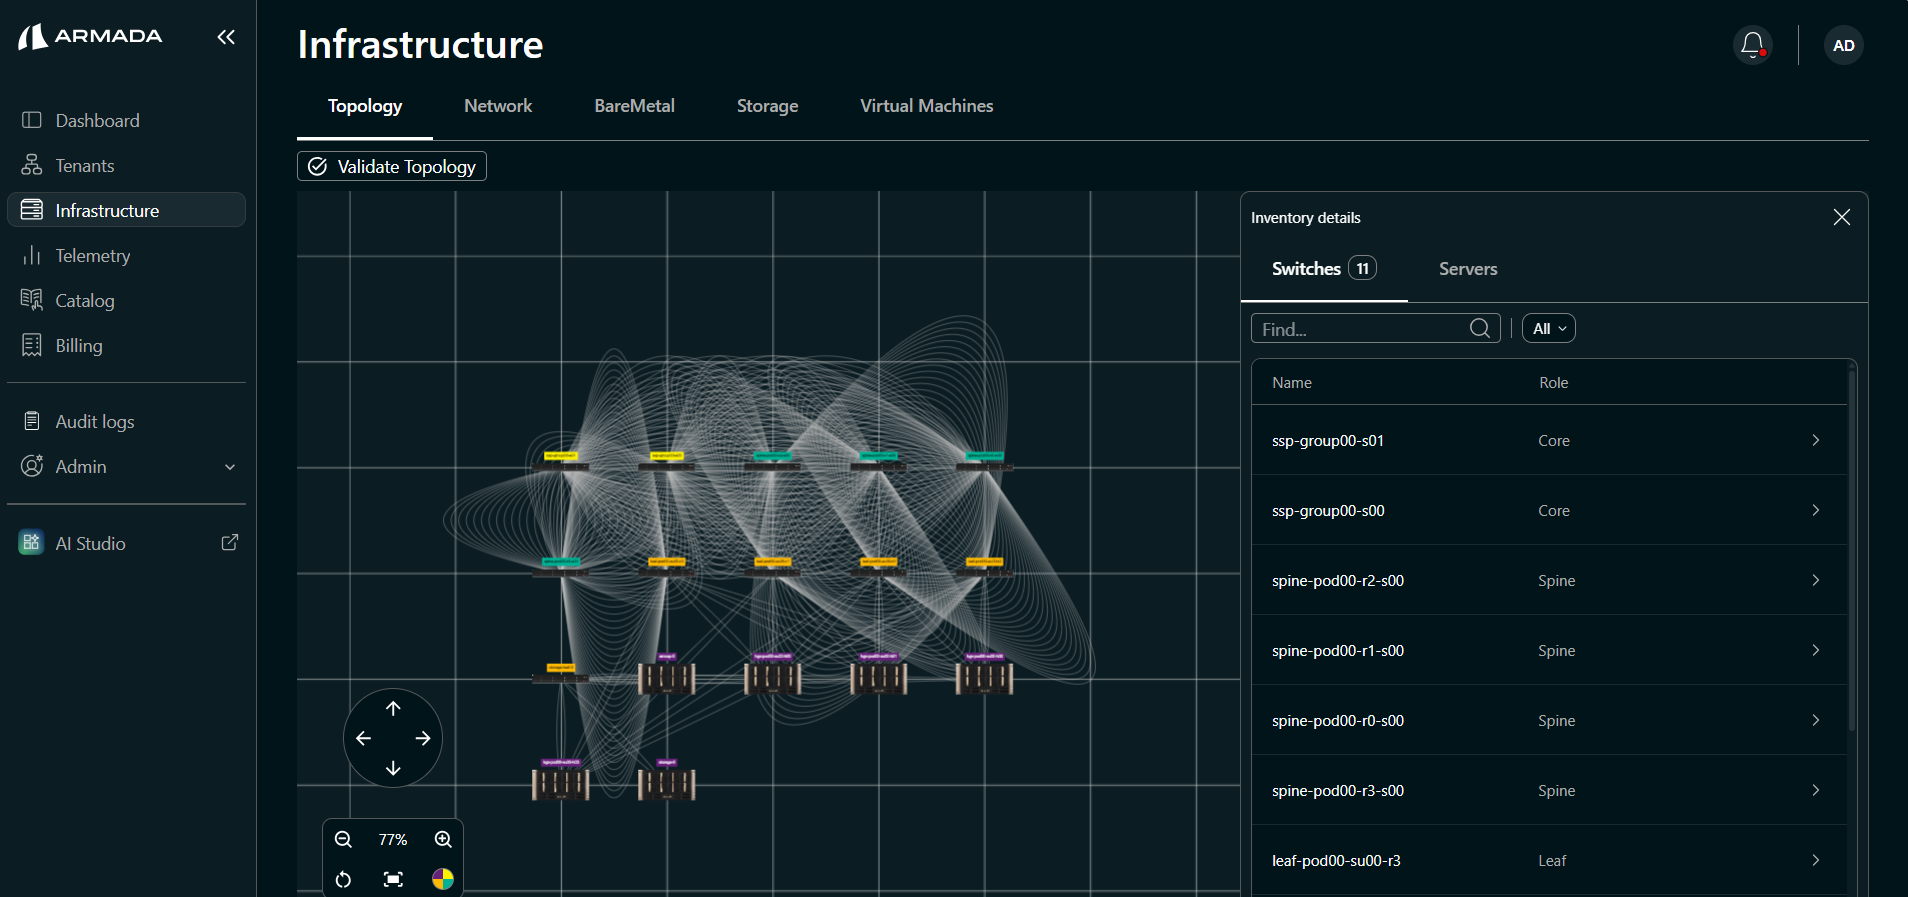
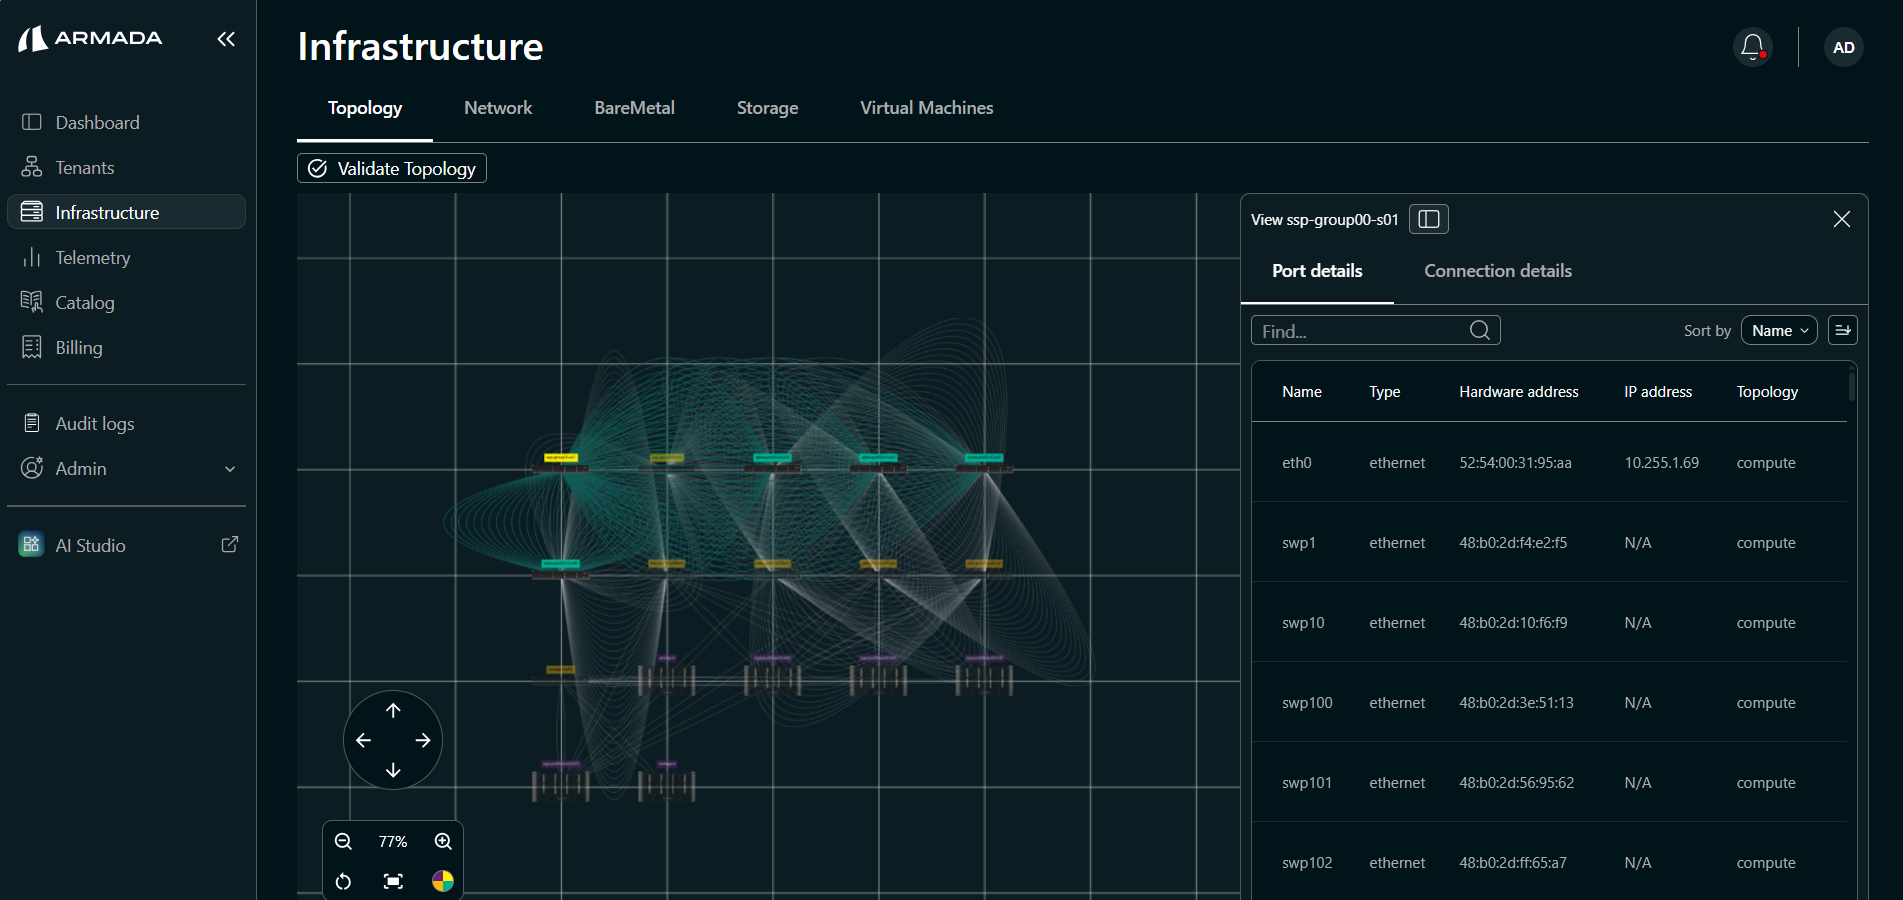
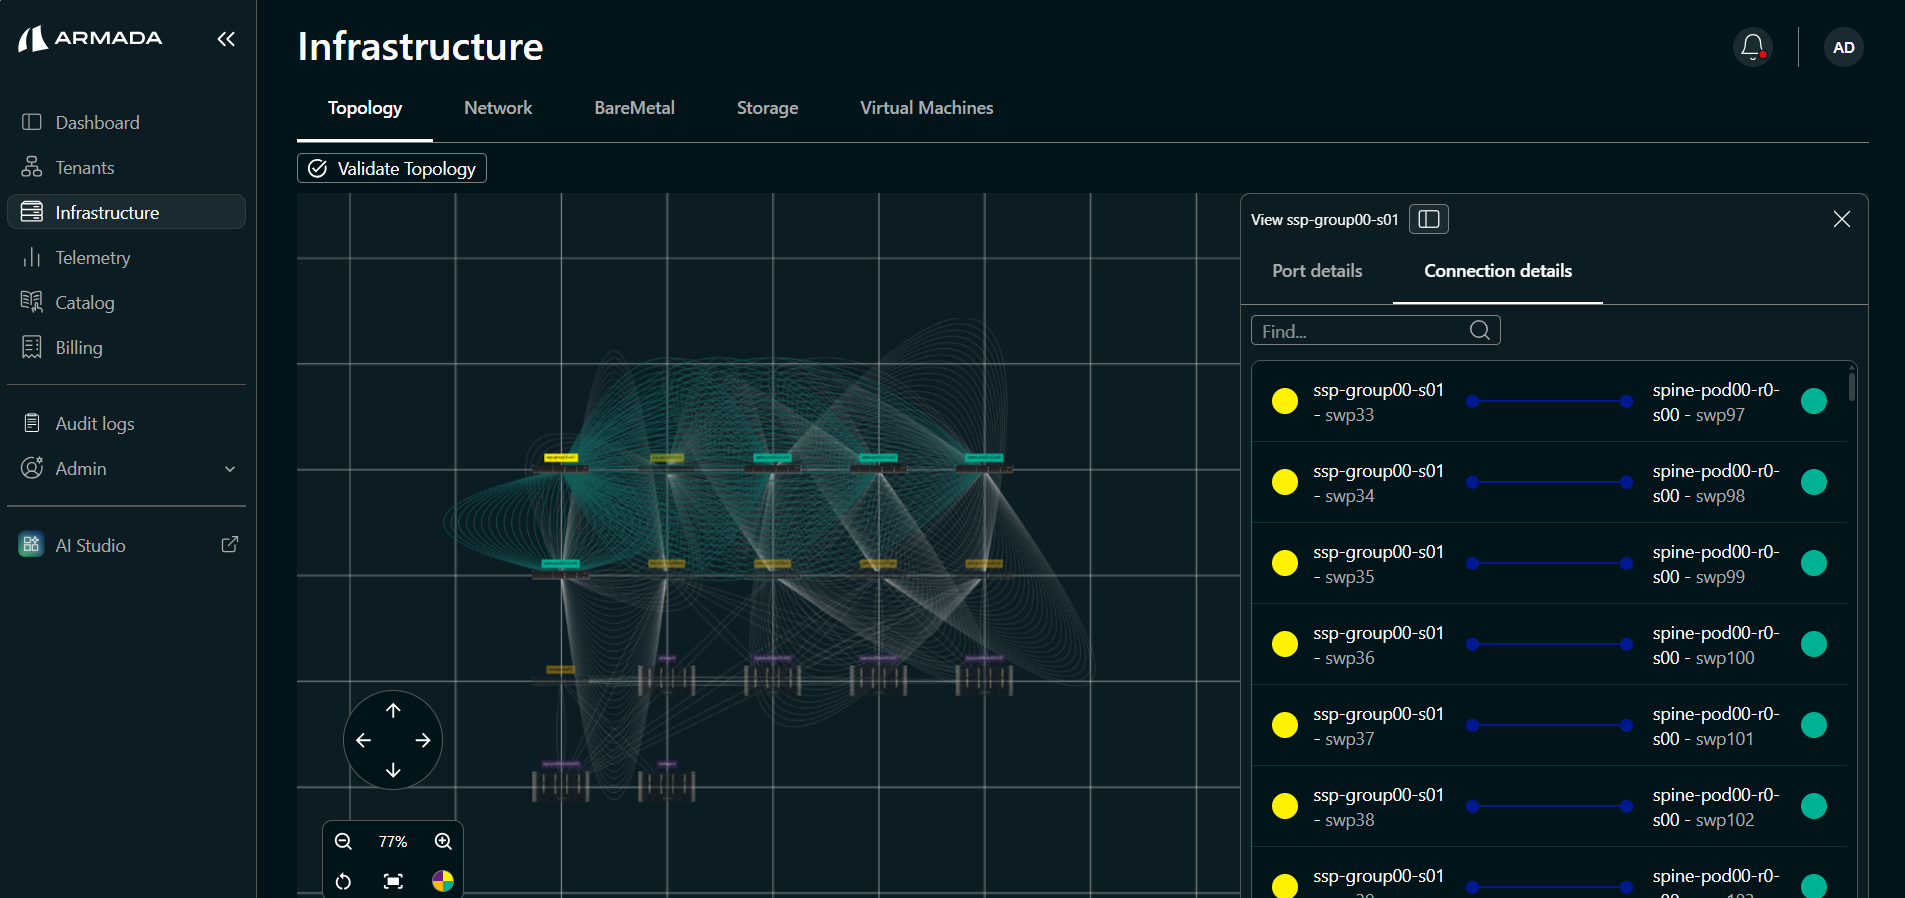
Click any switch expand icon (›) to check port and connection details.
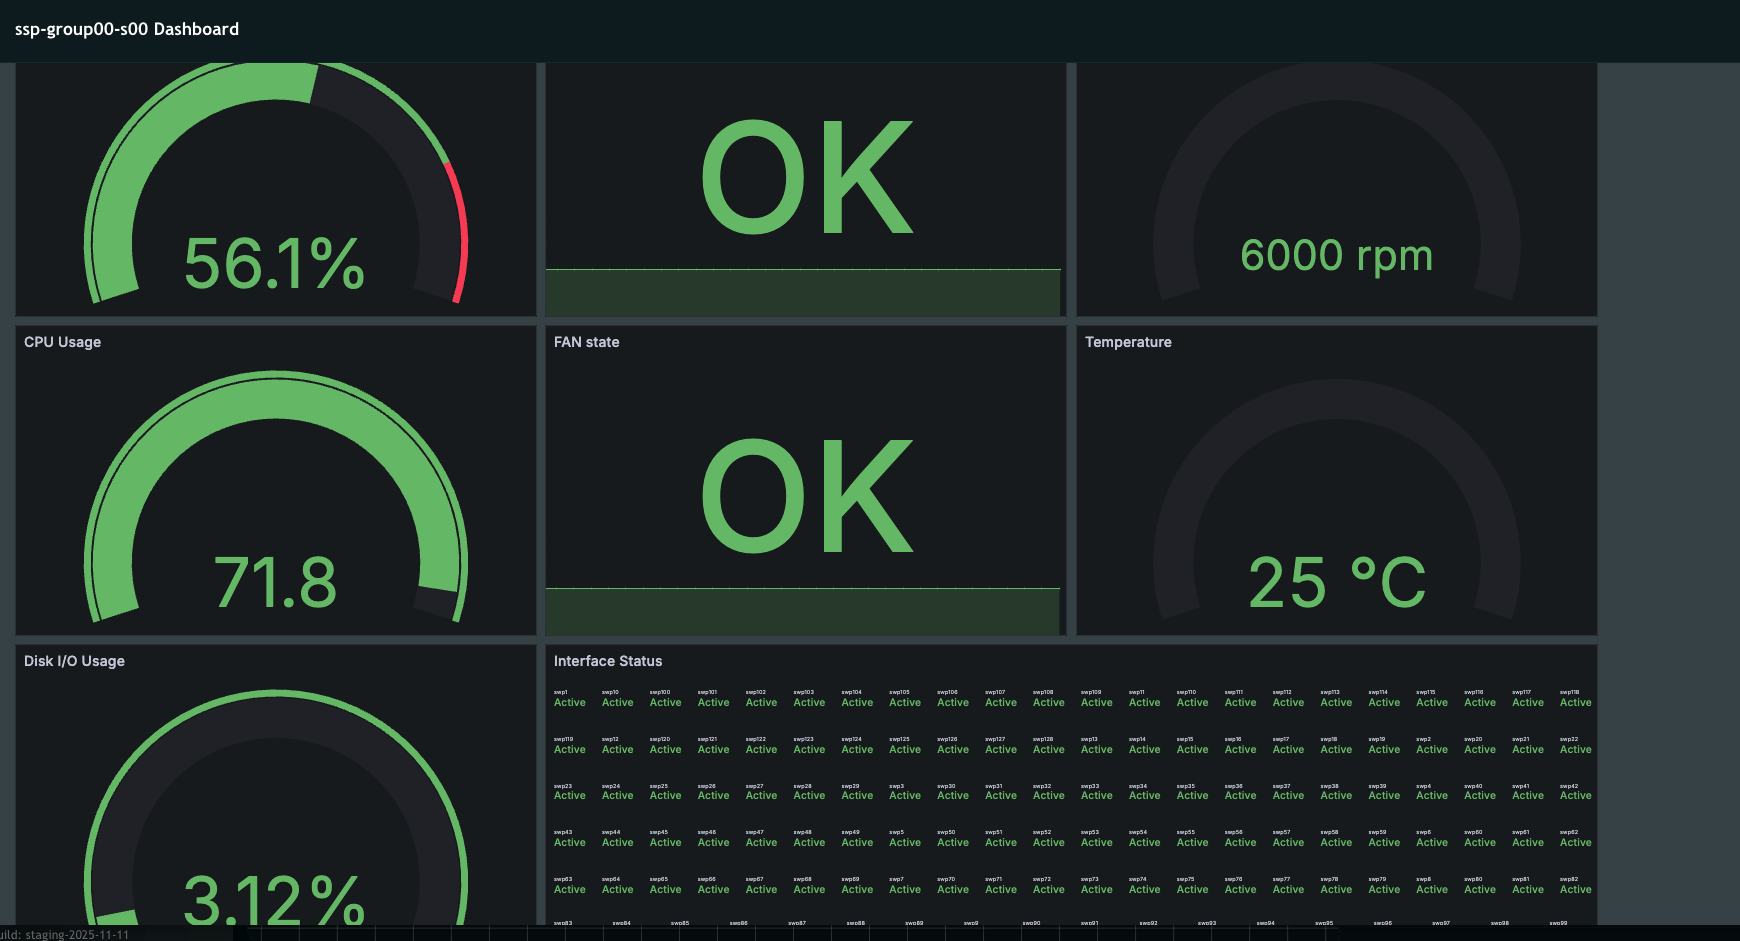
Click the Dashboard icon next to a switch name to view observability metrics:
- Memory Usage
- PSU state
- FAN Speed
- CPU Usage
- FAN state
- Temperature
- Disk I/O Usage
- Interface Status
- MTU
Servers
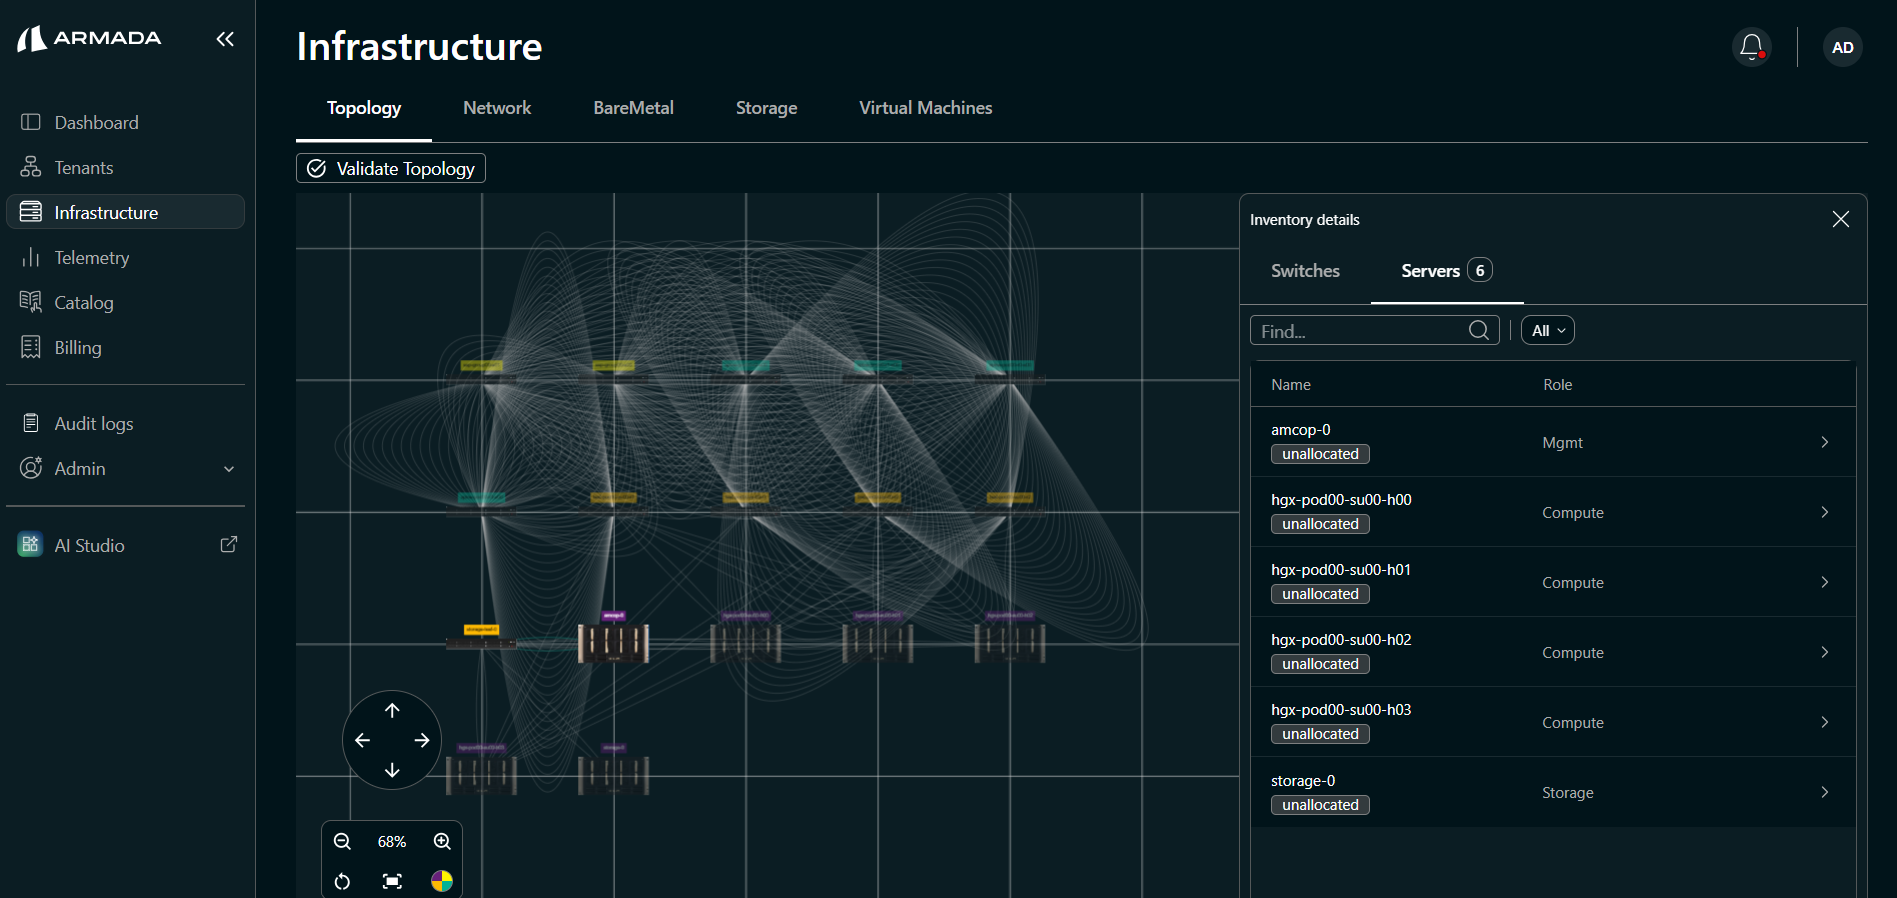
Navigate to Inventory Details → Servers tab to view discovered server details(compute, storage and mgmt).
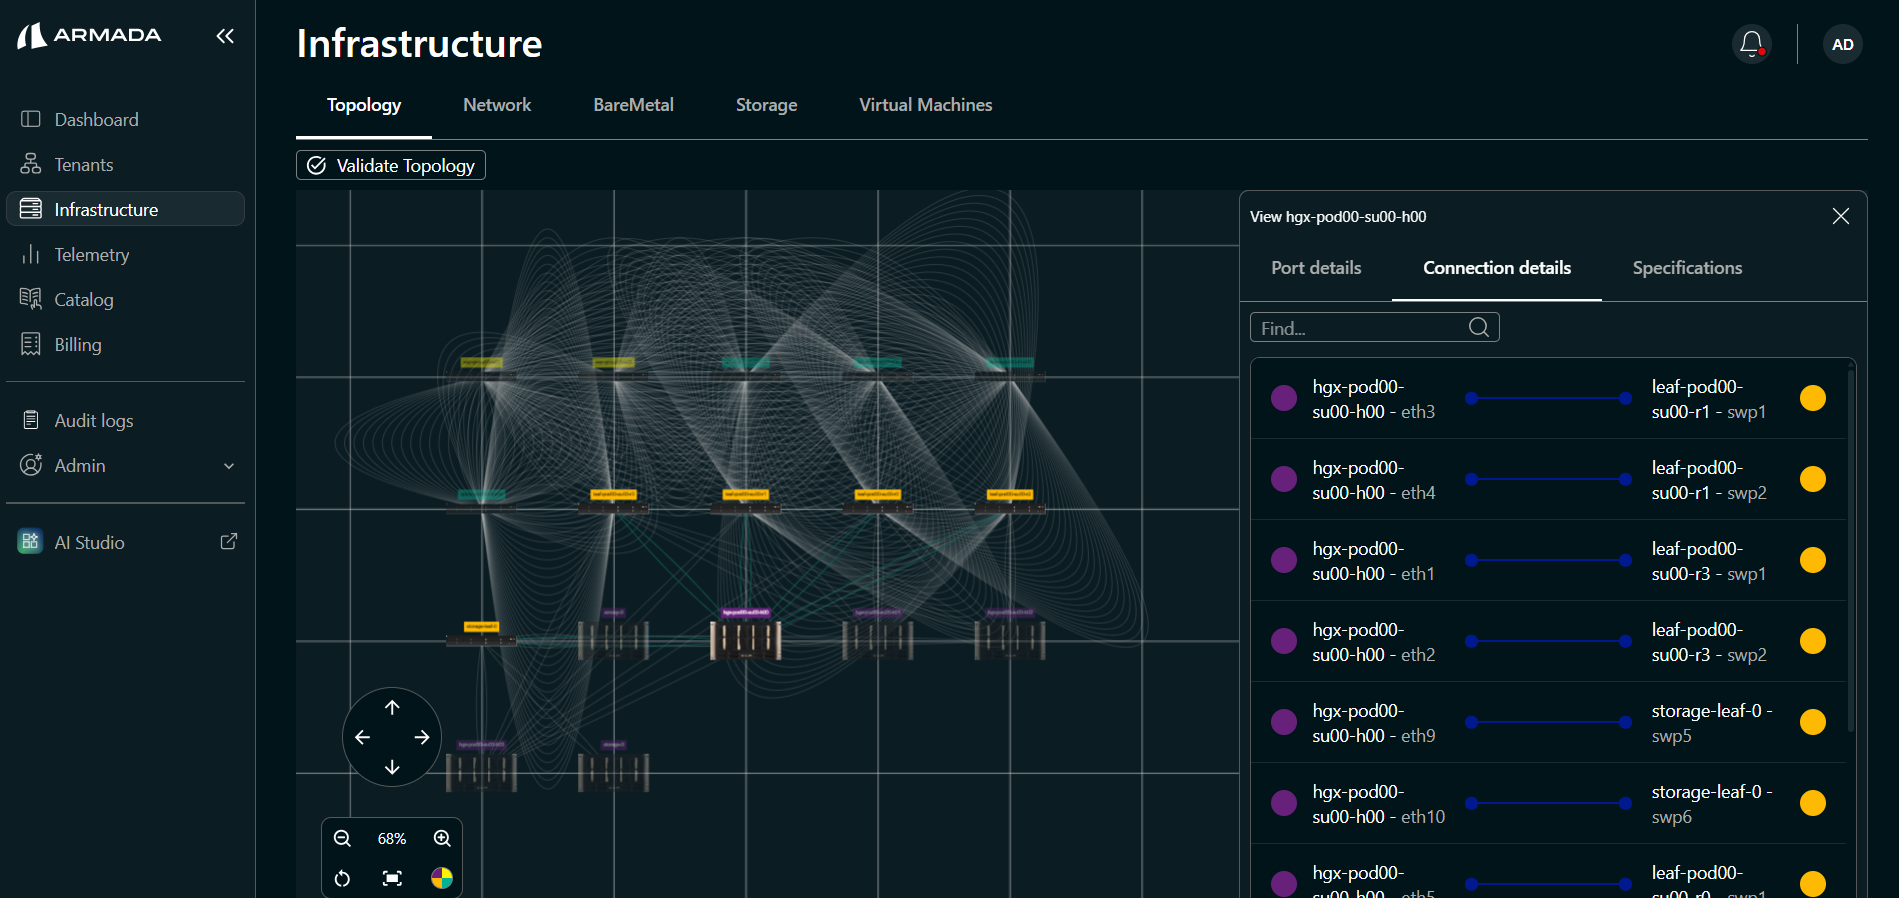
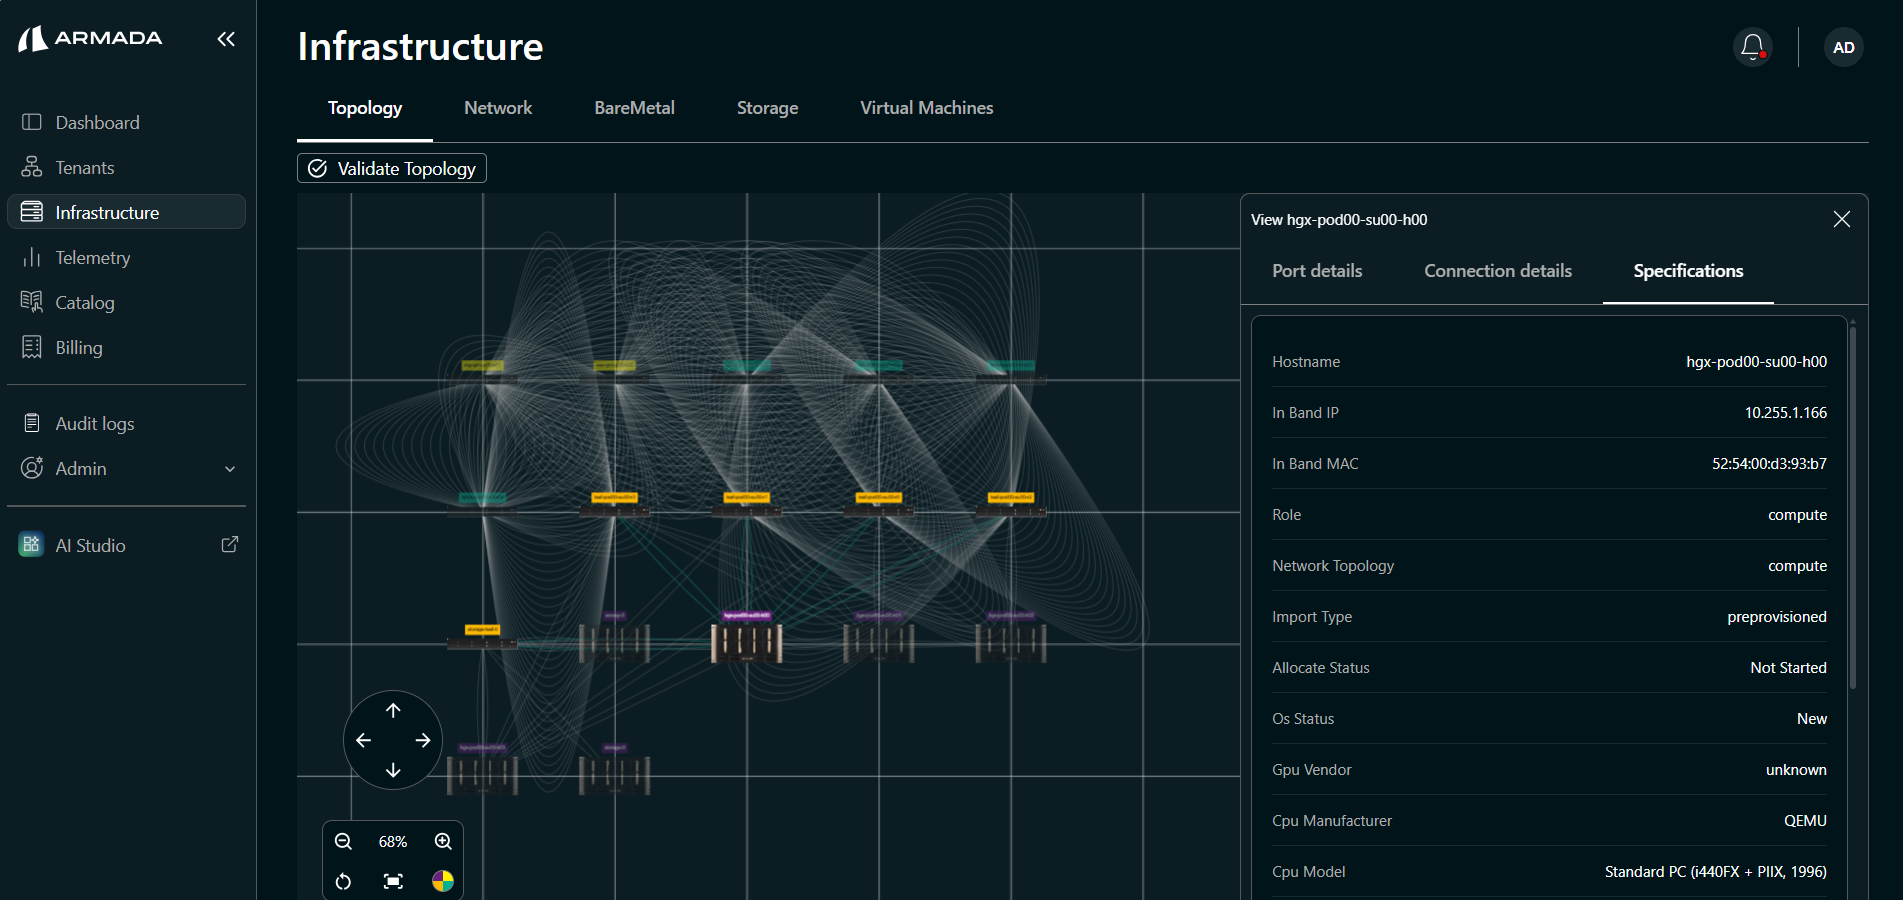
View Compute Details
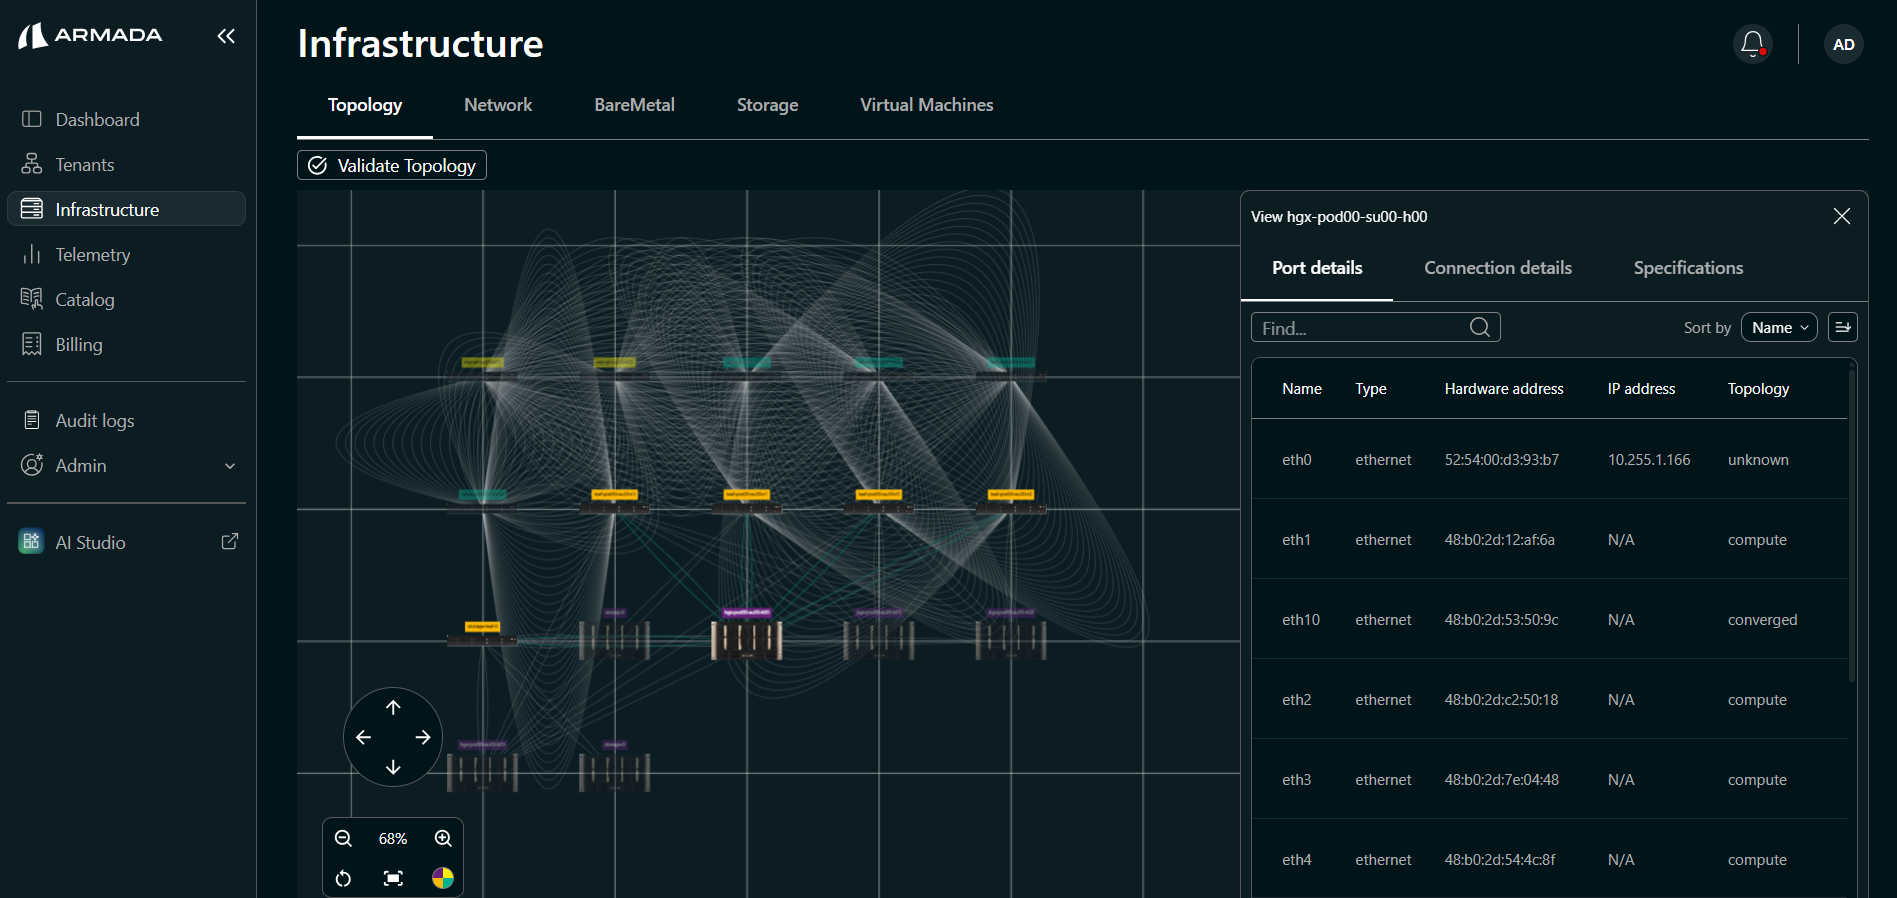
Click any Compute Device in the Topology View, or navigate via Inventory Details → Servers → click the compute expand icon (›) to view:
- Port Details
- Connection Details
- Specifications
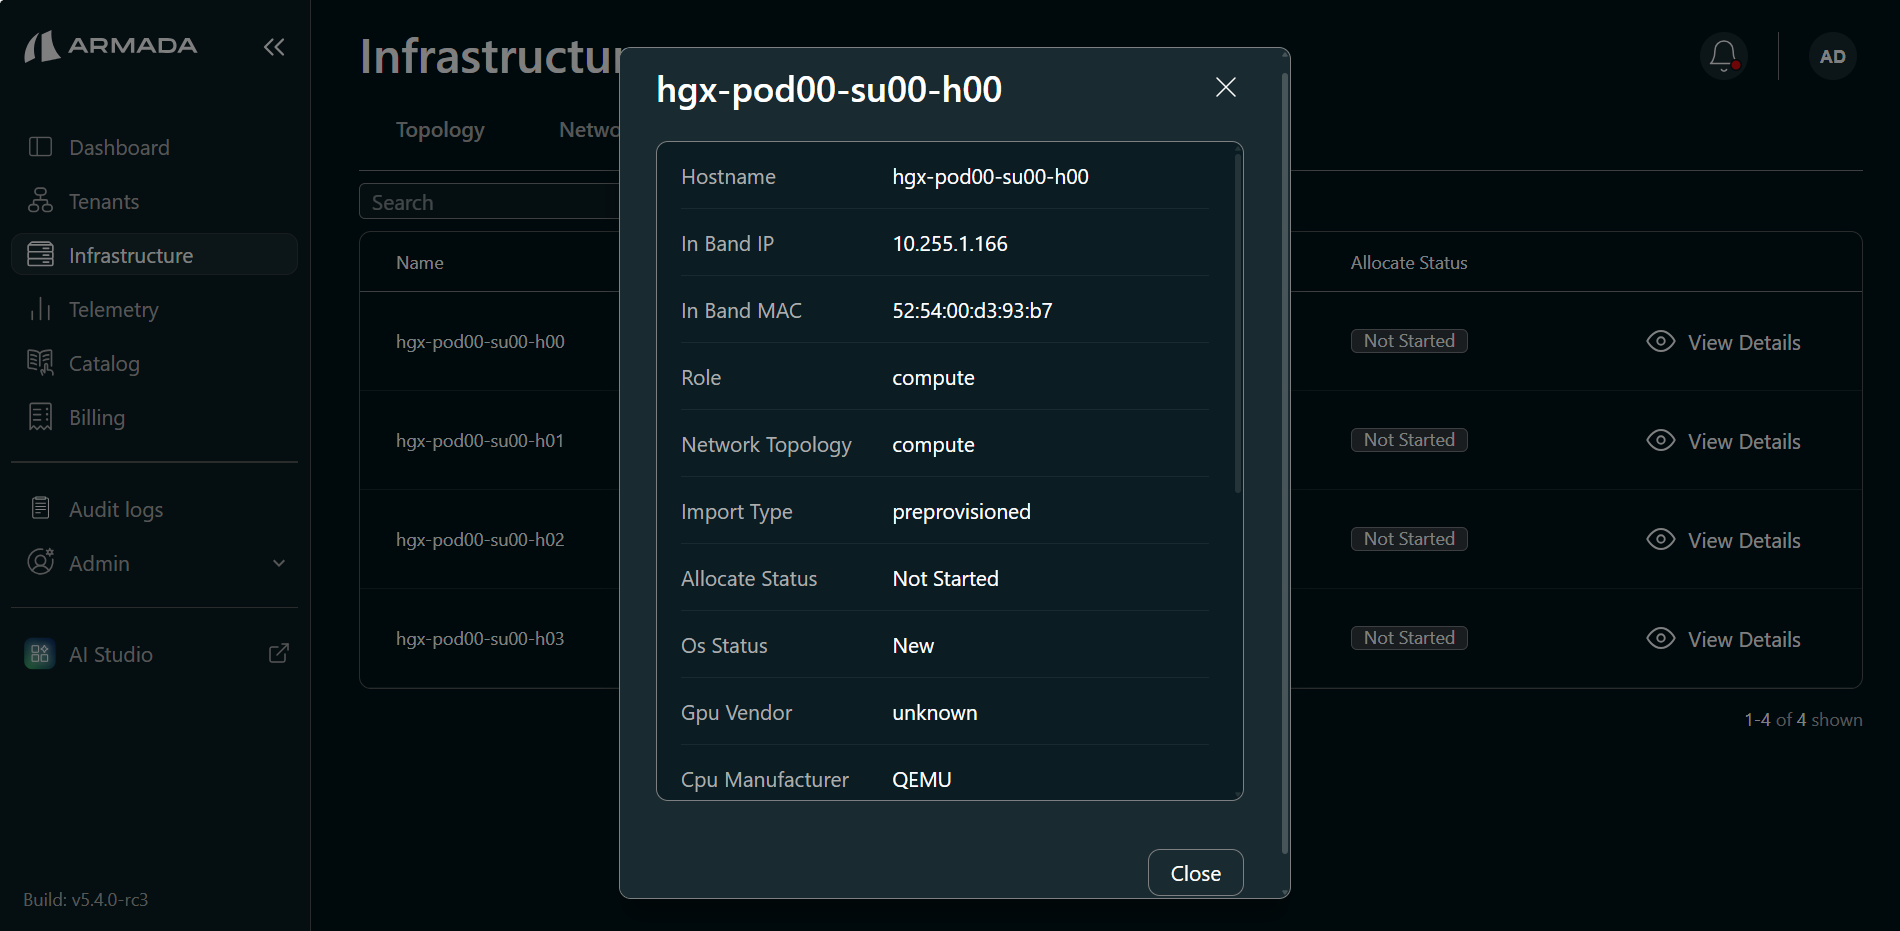
Click the Infrastructure → BareMetal tab to see the full list of available compute nodes.
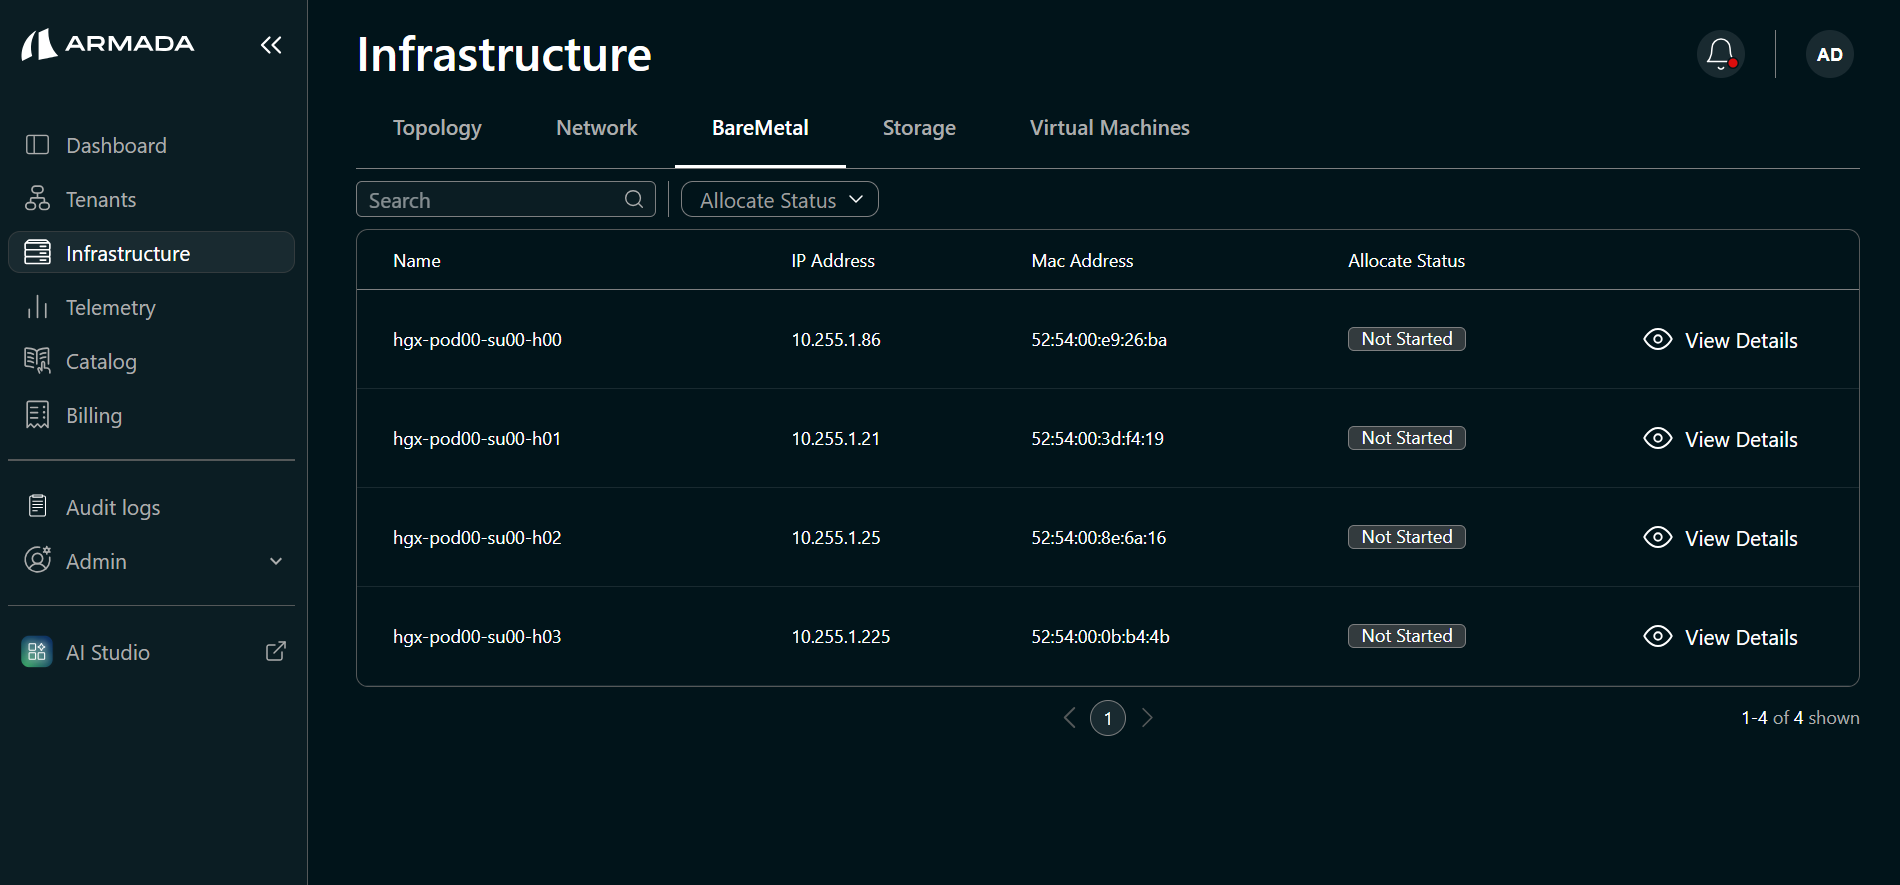
Click View Details on any node to see its full configuration.
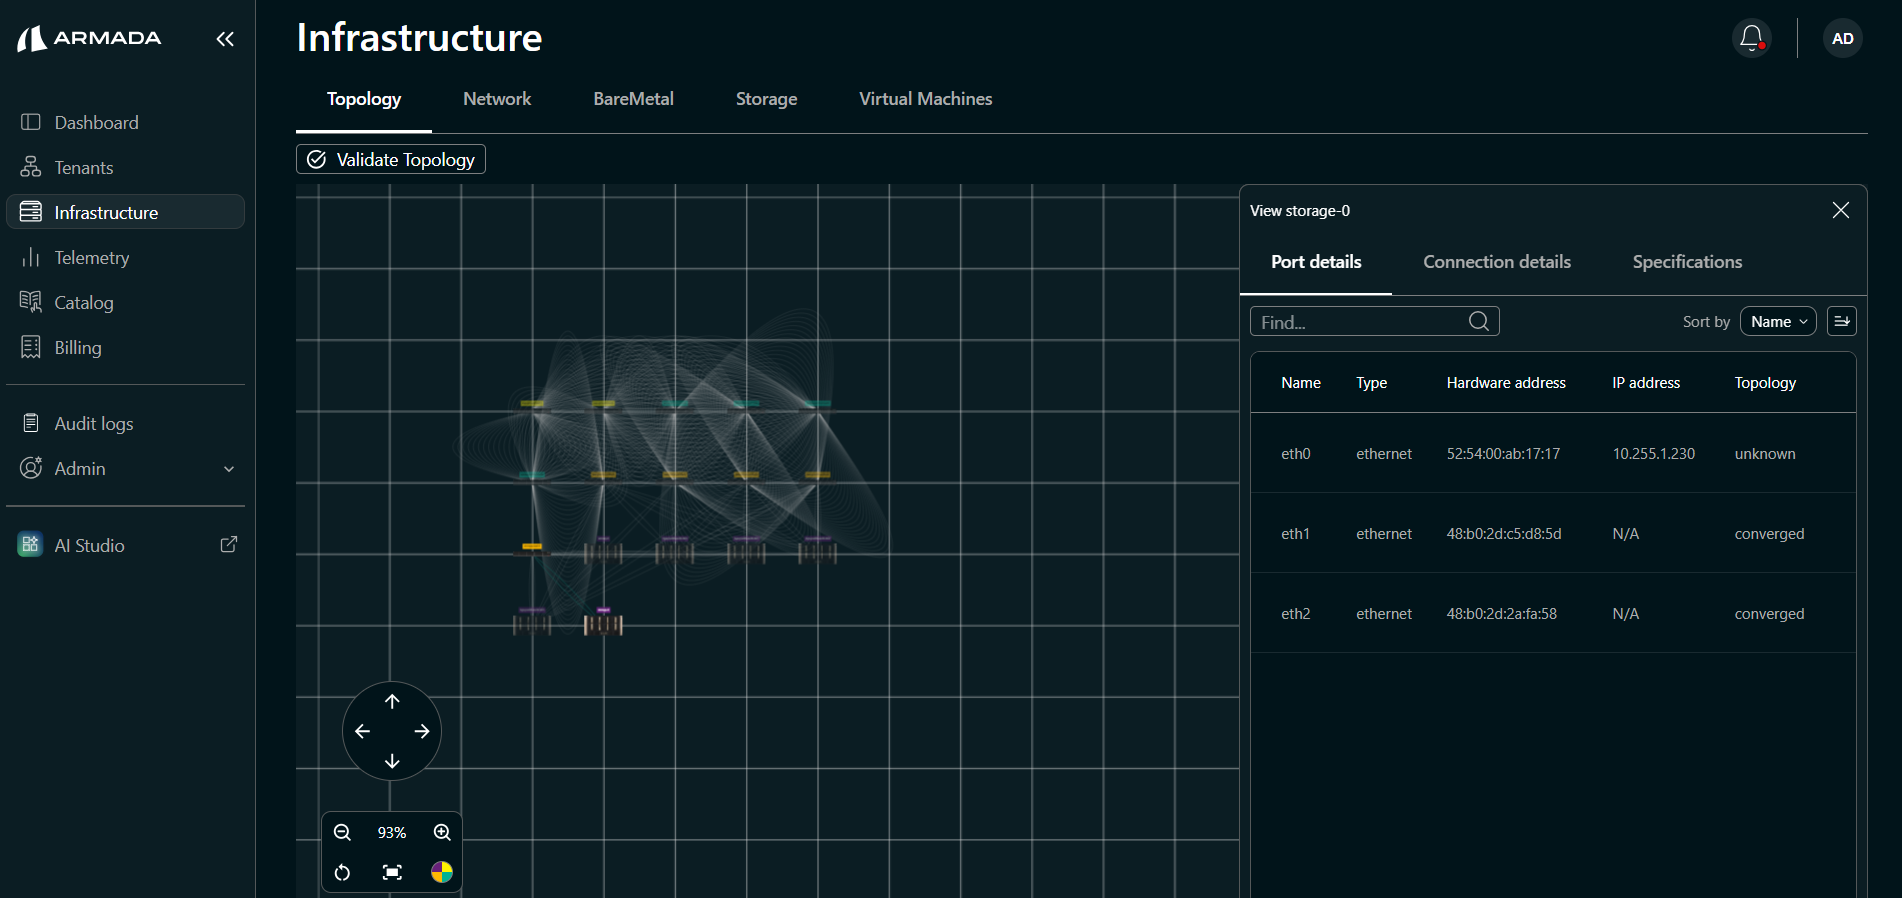
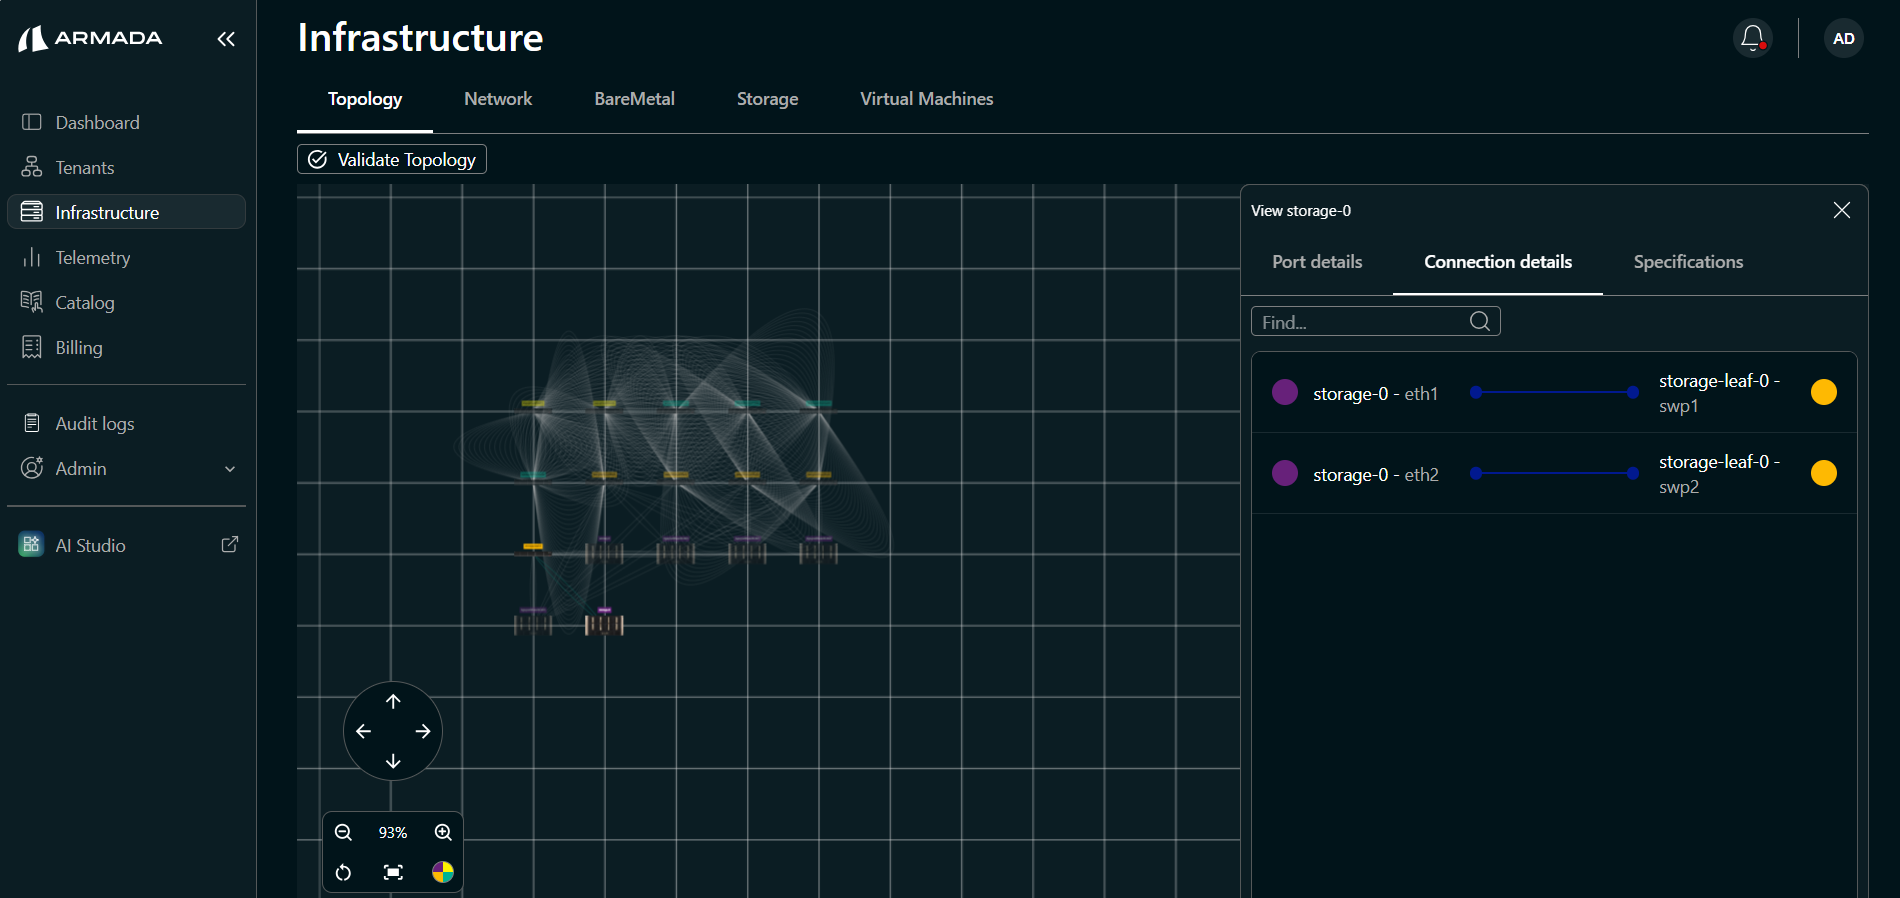
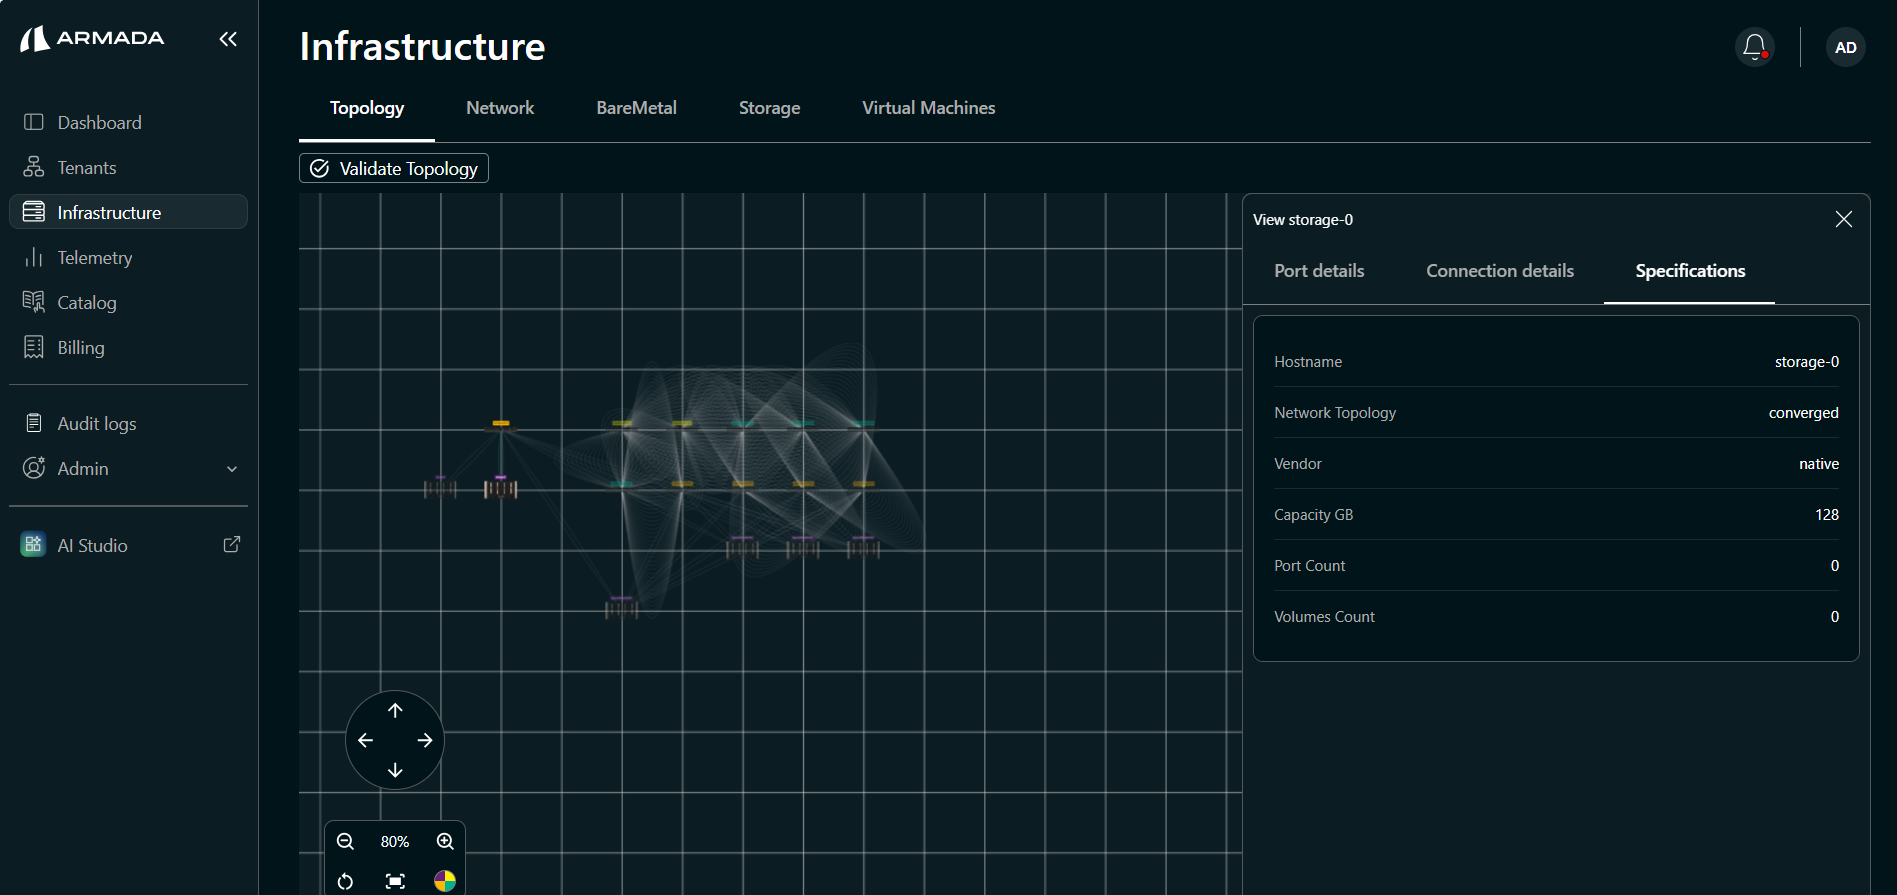
View Storage Details
Navigate to Inventory Details → Servers → click the storage expand icon (›) to view:
- Port Details
- Connection Details
- Specifications
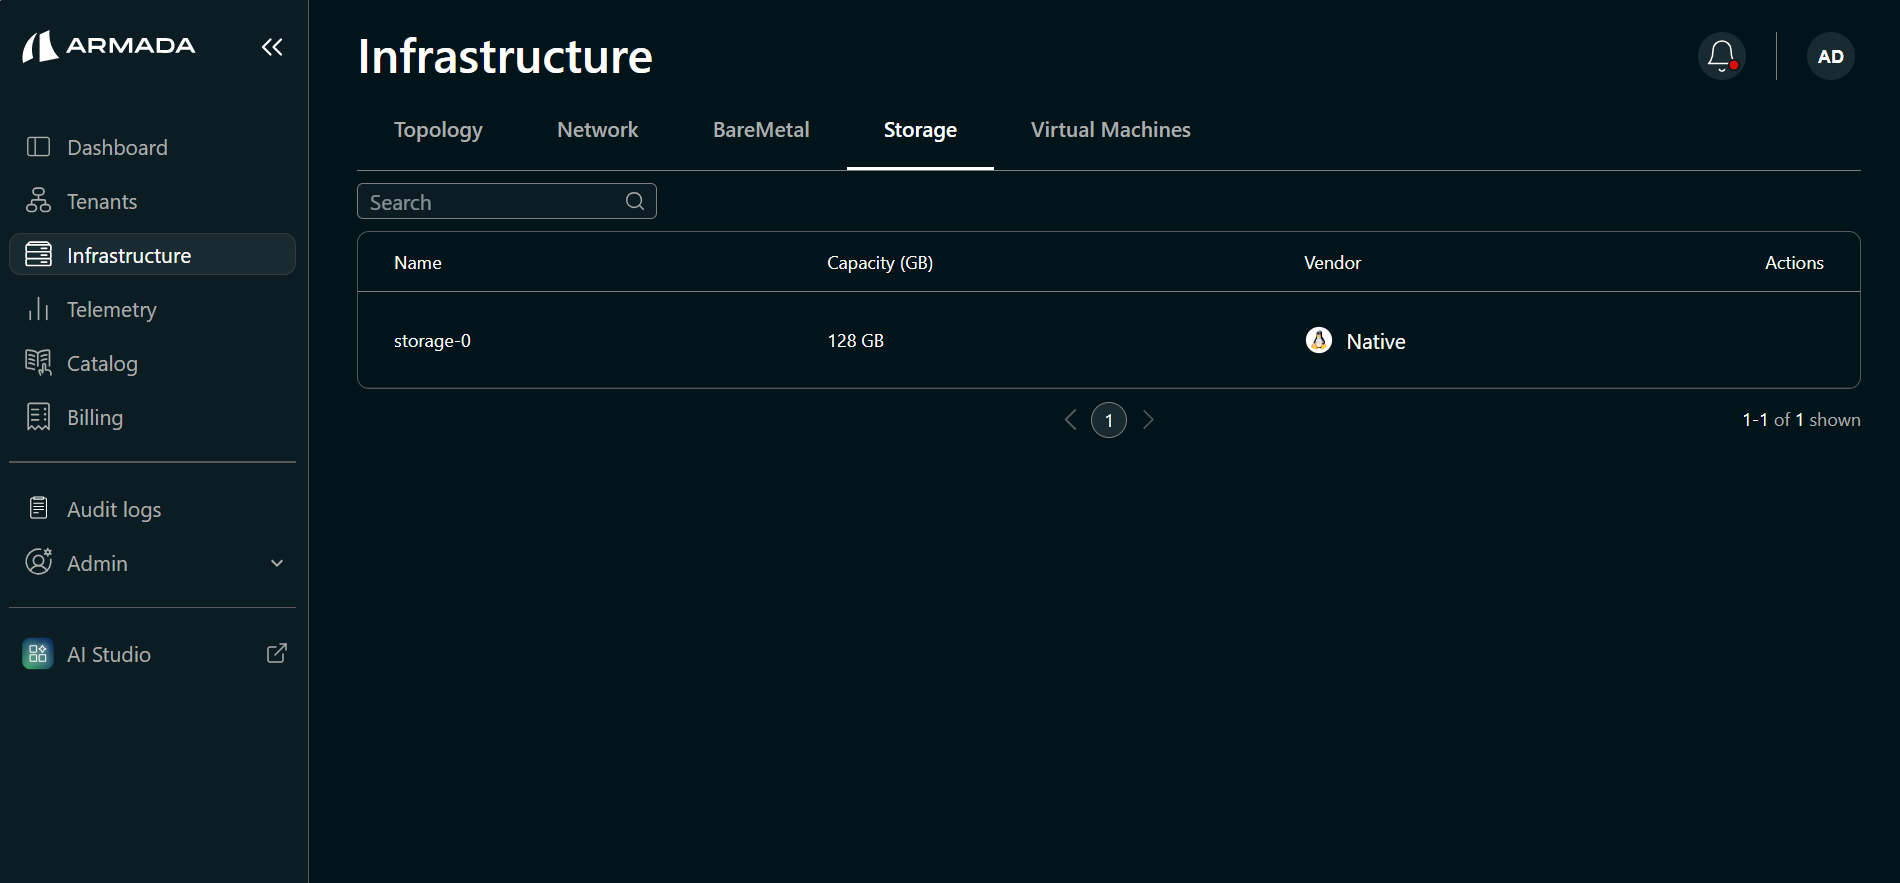
Click the Infrastructure → Storage tab to view the list of available storage devices.
Next Steps
- Configure Underlay Network — Configure the underlay network for the discovered topology.