Cluster Observability
Overview
Cluster Observability provides real-time monitoring and visualization of your Kubernetes cluster's health, resource utilization, and workload performance. It offers detailed insights into node, pod, and microservice-level metrics through interactive dashboards.
Prerequisites
- Tenant Admin access — Log in as a Tenant Admin.
- Cluster in Running state — A Kubernetes cluster must be created and in a Running state.
Cluster Level Observability
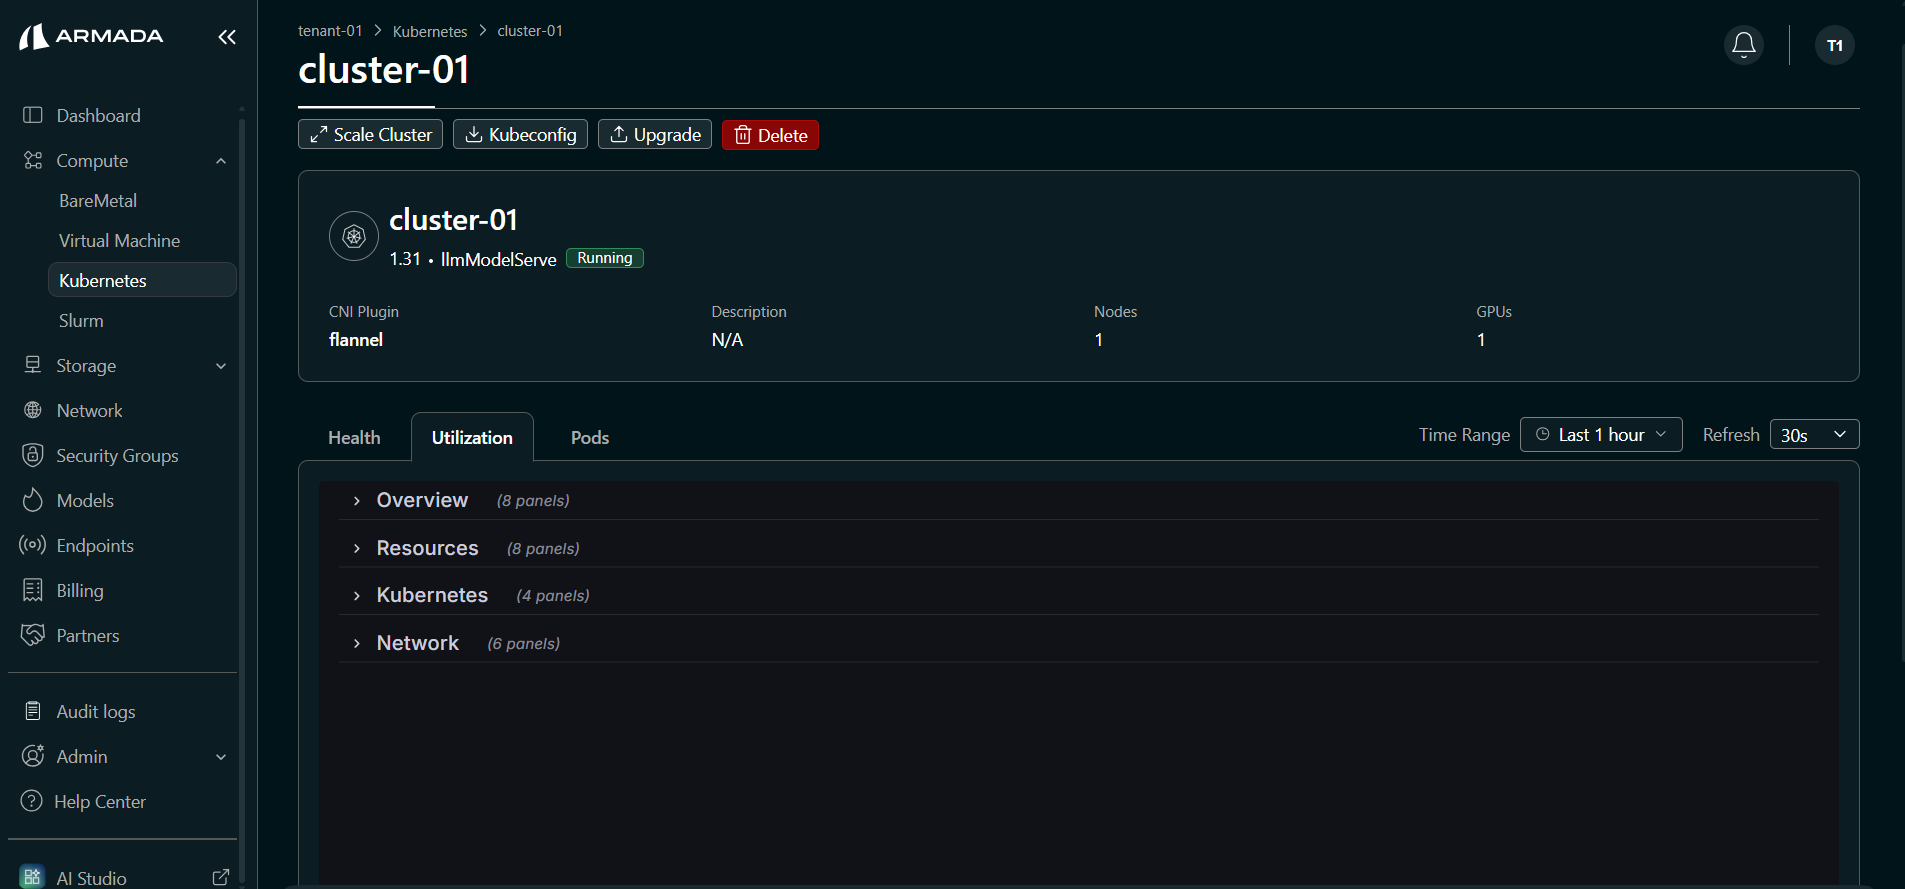
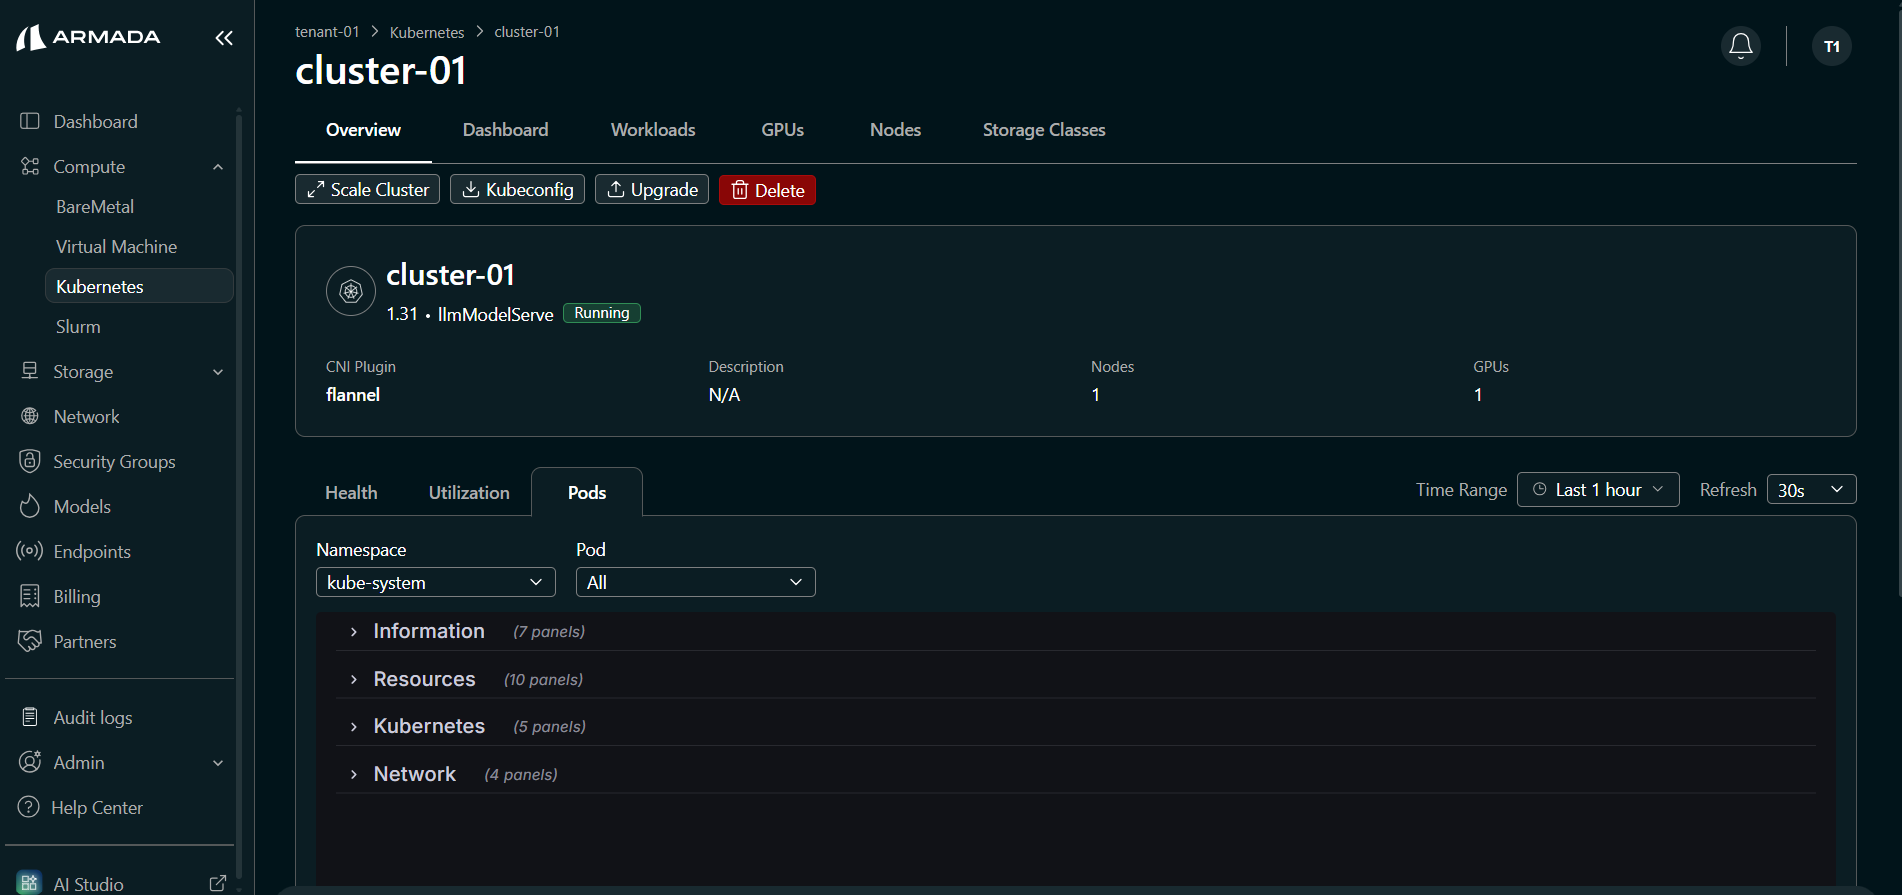
Accessing Cluster Level Observability
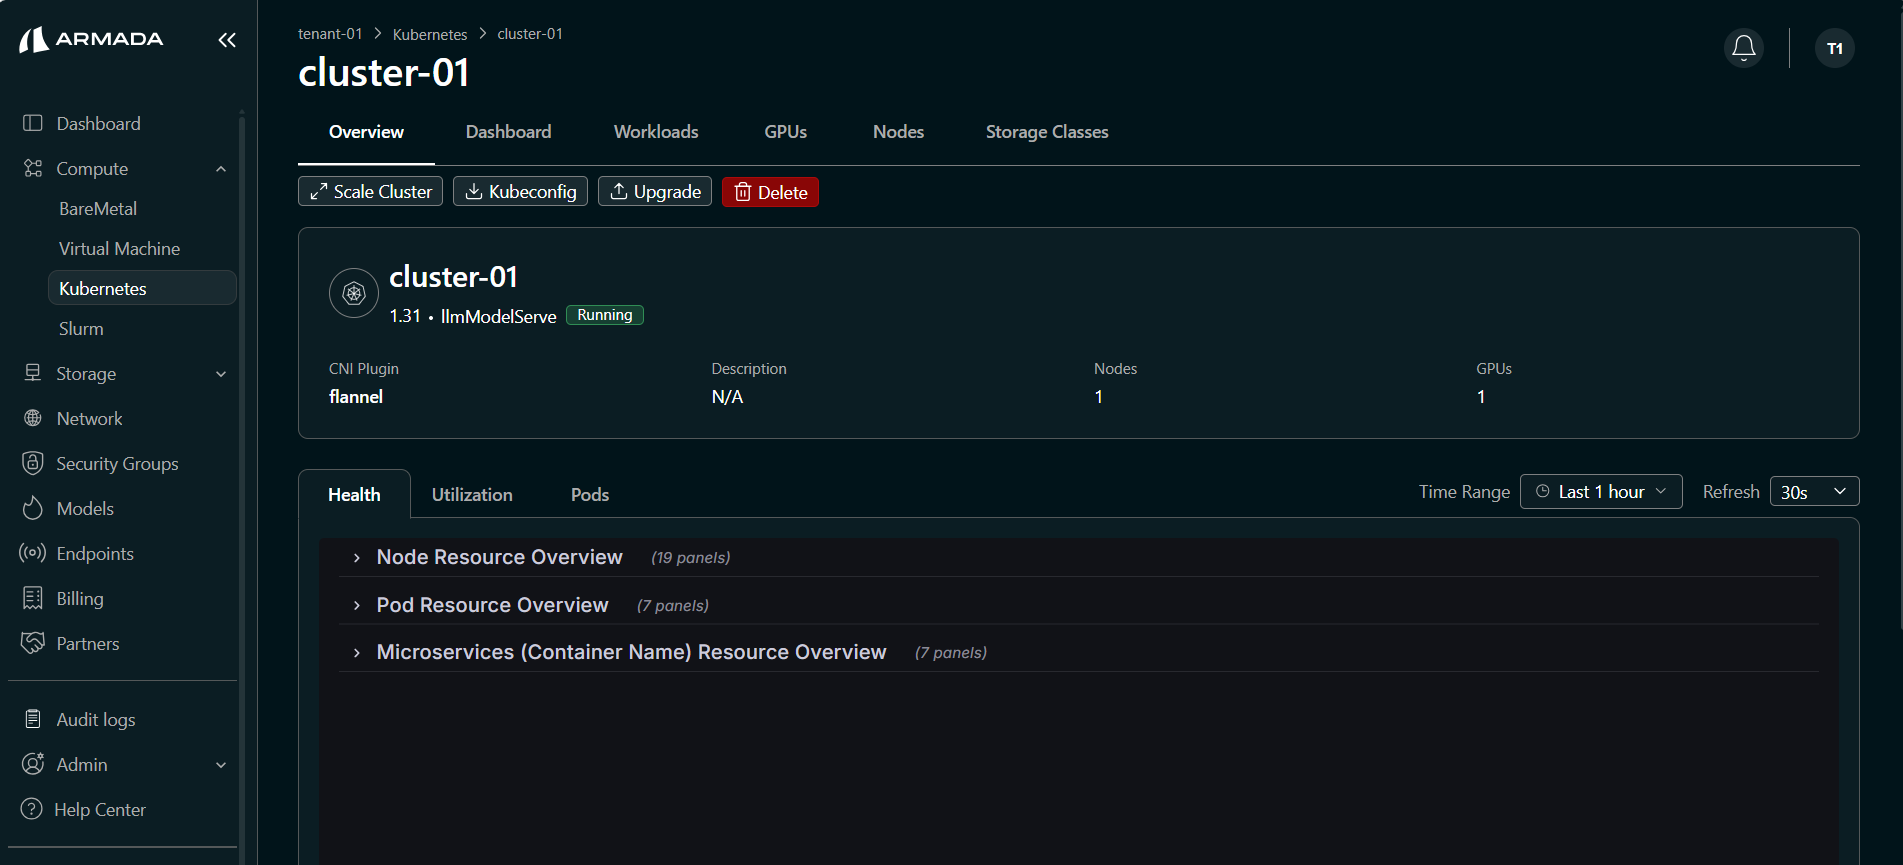
- Navigate to Compute → Kubernetes and click on your cluster name to open the cluster detail view.
- The cluster detail page opens on the Overview tab by default.
- The Overview tab contains three sub-sections: Health, Utilization, and Pods.
You can adjust the Time Range (e.g., Last 1 hour) and Refresh interval (e.g., 30s) using the controls in the top-right corner.
Health
The Health sub-section provides a comprehensive view of cluster health through three expandable panels:
- Node Resource Overview — Aggregated metrics for all nodes in the cluster.
- Pod Resource Overview — Resource consumption details for individual pods.
- Microservices (Container Name) Resource Overview — Per-container metrics for microservices running in the cluster.
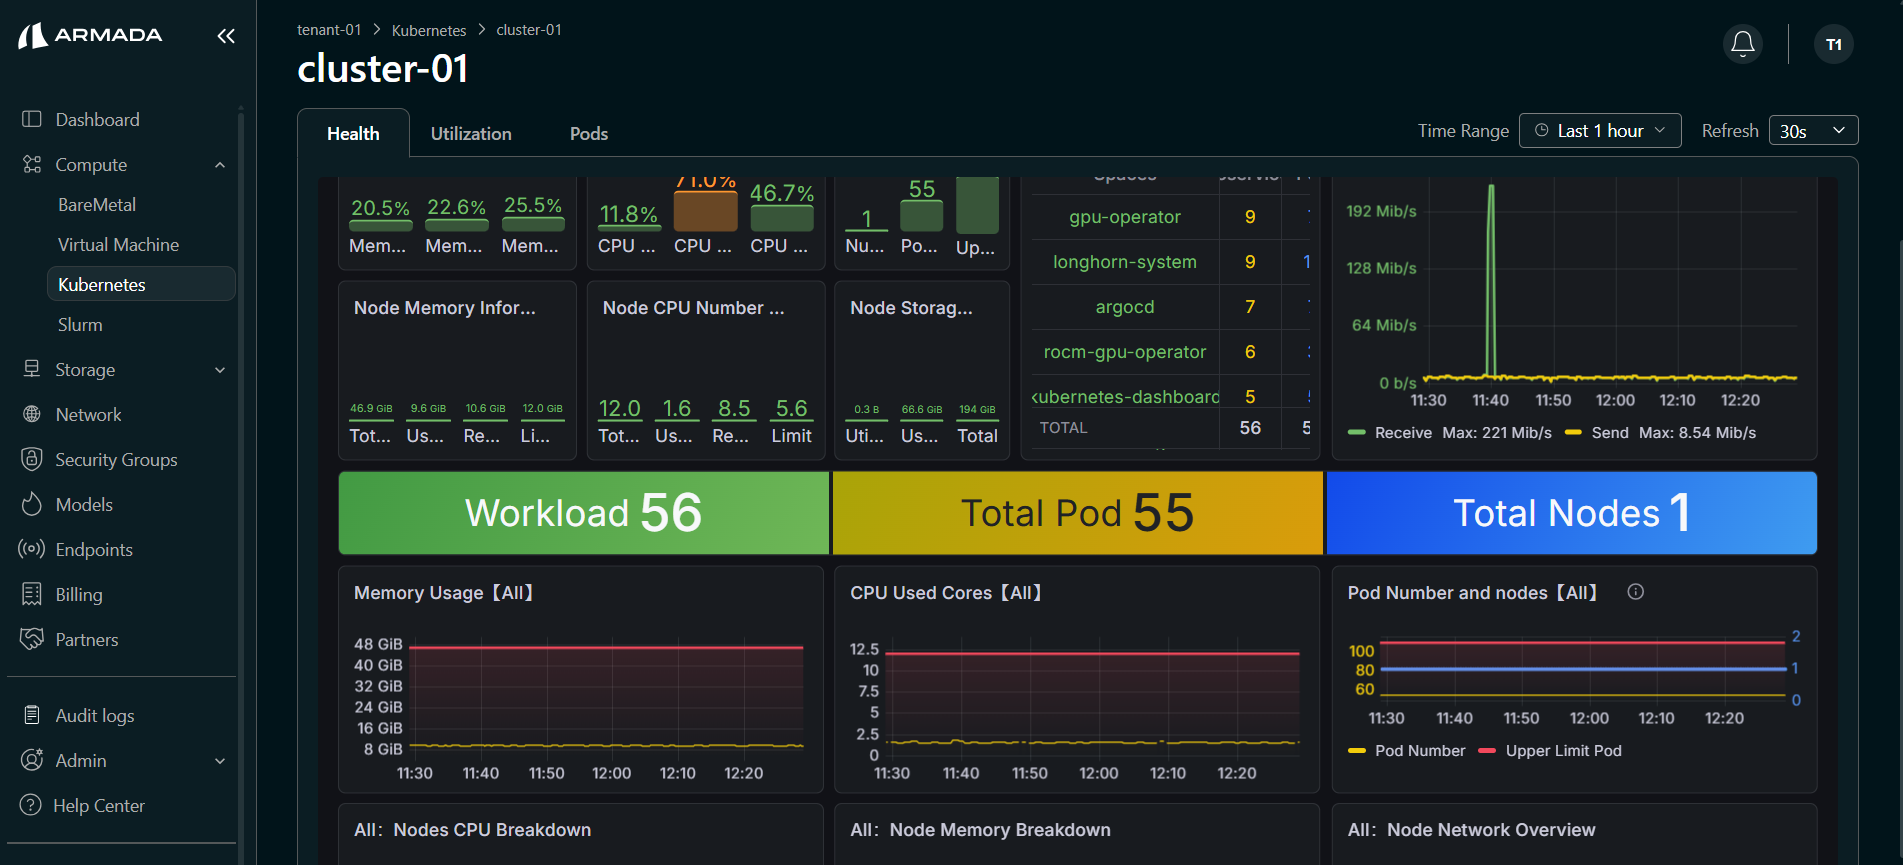
Node Resource Overview
The Node Resource Overview panel displays aggregated metrics across all nodes in the cluster, helping tenant administrators monitor infrastructure-level health at a glance.
Key metrics include:
| Panel | Description |
|---|---|
| Node Memory Ratio | Memory utilization, usage, and limits as a percentage of total node memory |
| Node CPU Ratio | CPU utilization, request, and limit ratios across all nodes |
| Nodes with Pod | Summary counts — total number of pods, nodes, and upper pod limits |
| Namespace Resource Statistics | Breakdown of resource counts (services, pods) per namespace |
| Network Overview | Network receive and send throughput (Mib/s) over time |
| Workload / Total Pod / Total Nodes | Aggregate counts of workloads, pods, and nodes in the cluster |
| Memory Usage [All] | Time-series chart of total memory usage across all nodes |
| CPU Used Cores [All] | Time-series chart of total CPU core usage across all nodes |
| Pod Number and Nodes [All] | Pod count vs. upper pod limit over time |
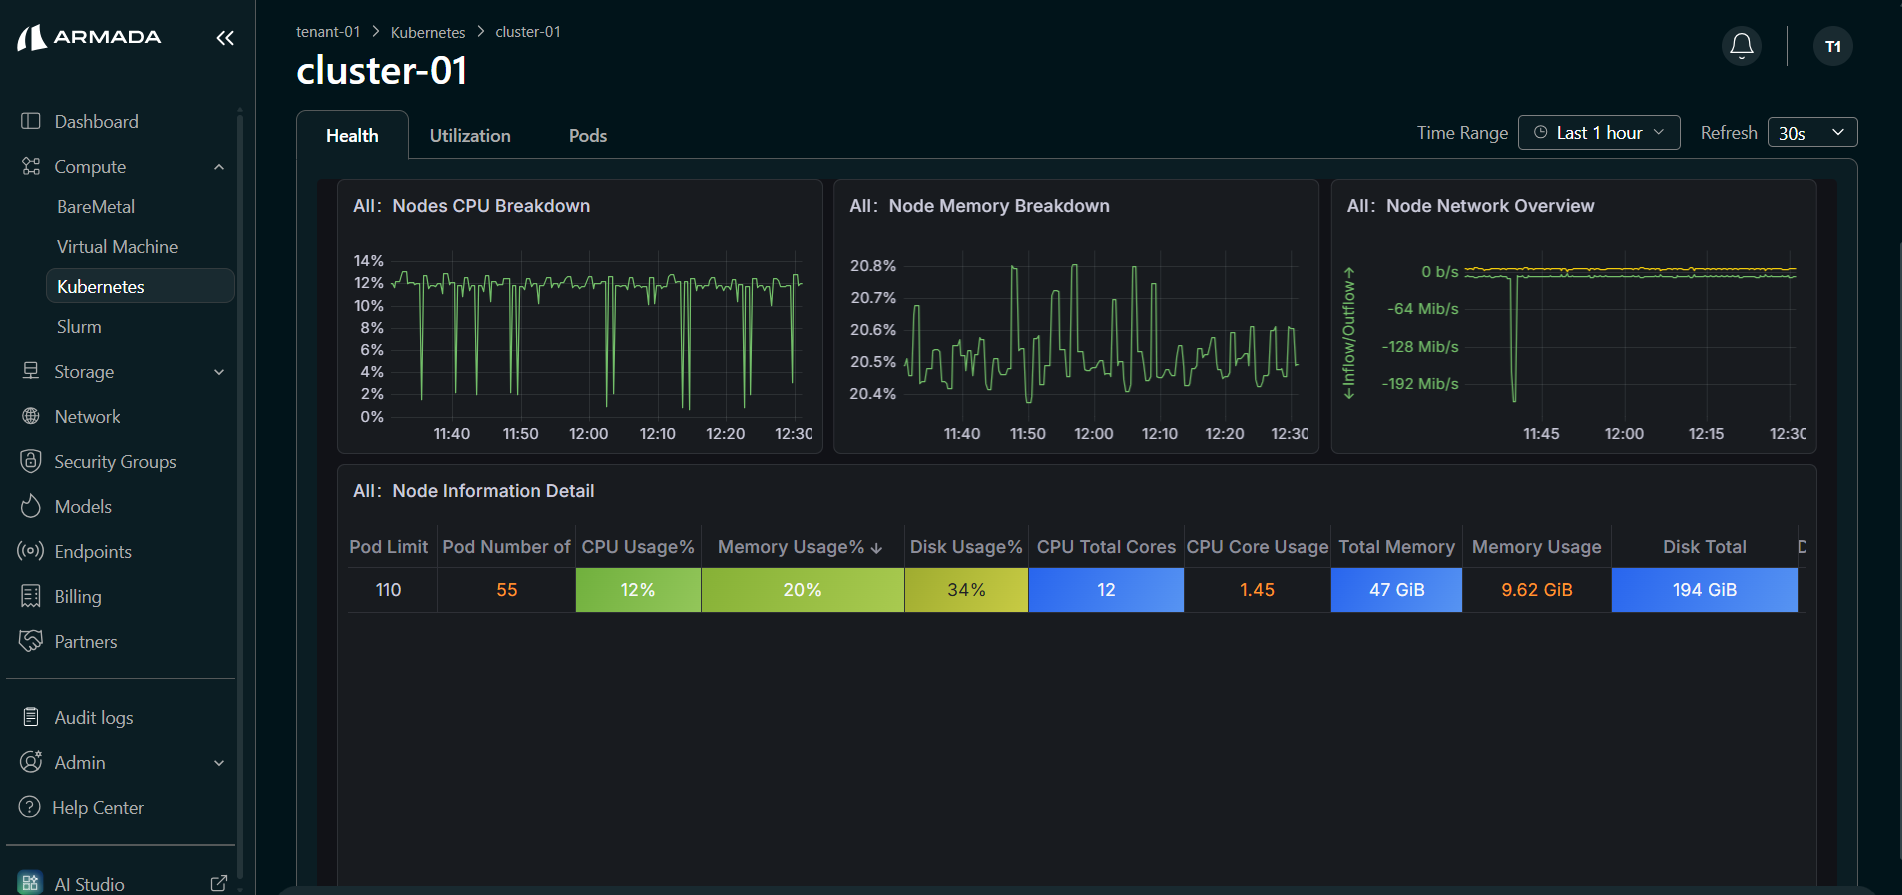
Additional node-level panels:
| Panel | Description |
|---|---|
| Nodes CPU Breakdown | Per-node CPU usage breakdown over time |
| Node Memory Breakdown | Per-node memory usage breakdown over time |
| Node Network Overview | Inflow and outflow network traffic per node |
| Node Information Detail | Table with per-node details — Pod Limit, CPU Usage%, Memory Usage%, Disk Usage%, CPU Total Cores, Memory Total, Disk Total, and more |
Storage and namespace panels:
| Panel | Description |
|---|---|
| PVC Storage Usage | Persistent Volume Claim usage, total, usage rate, and mount path |
| Namespaces CPU Usage | CPU consumption per namespace (kernel-level, >0.005 cores) |
| Namespaces WSS Memory Usage | Working Set Size (WSS) memory consumption per namespace (>100MiB) |
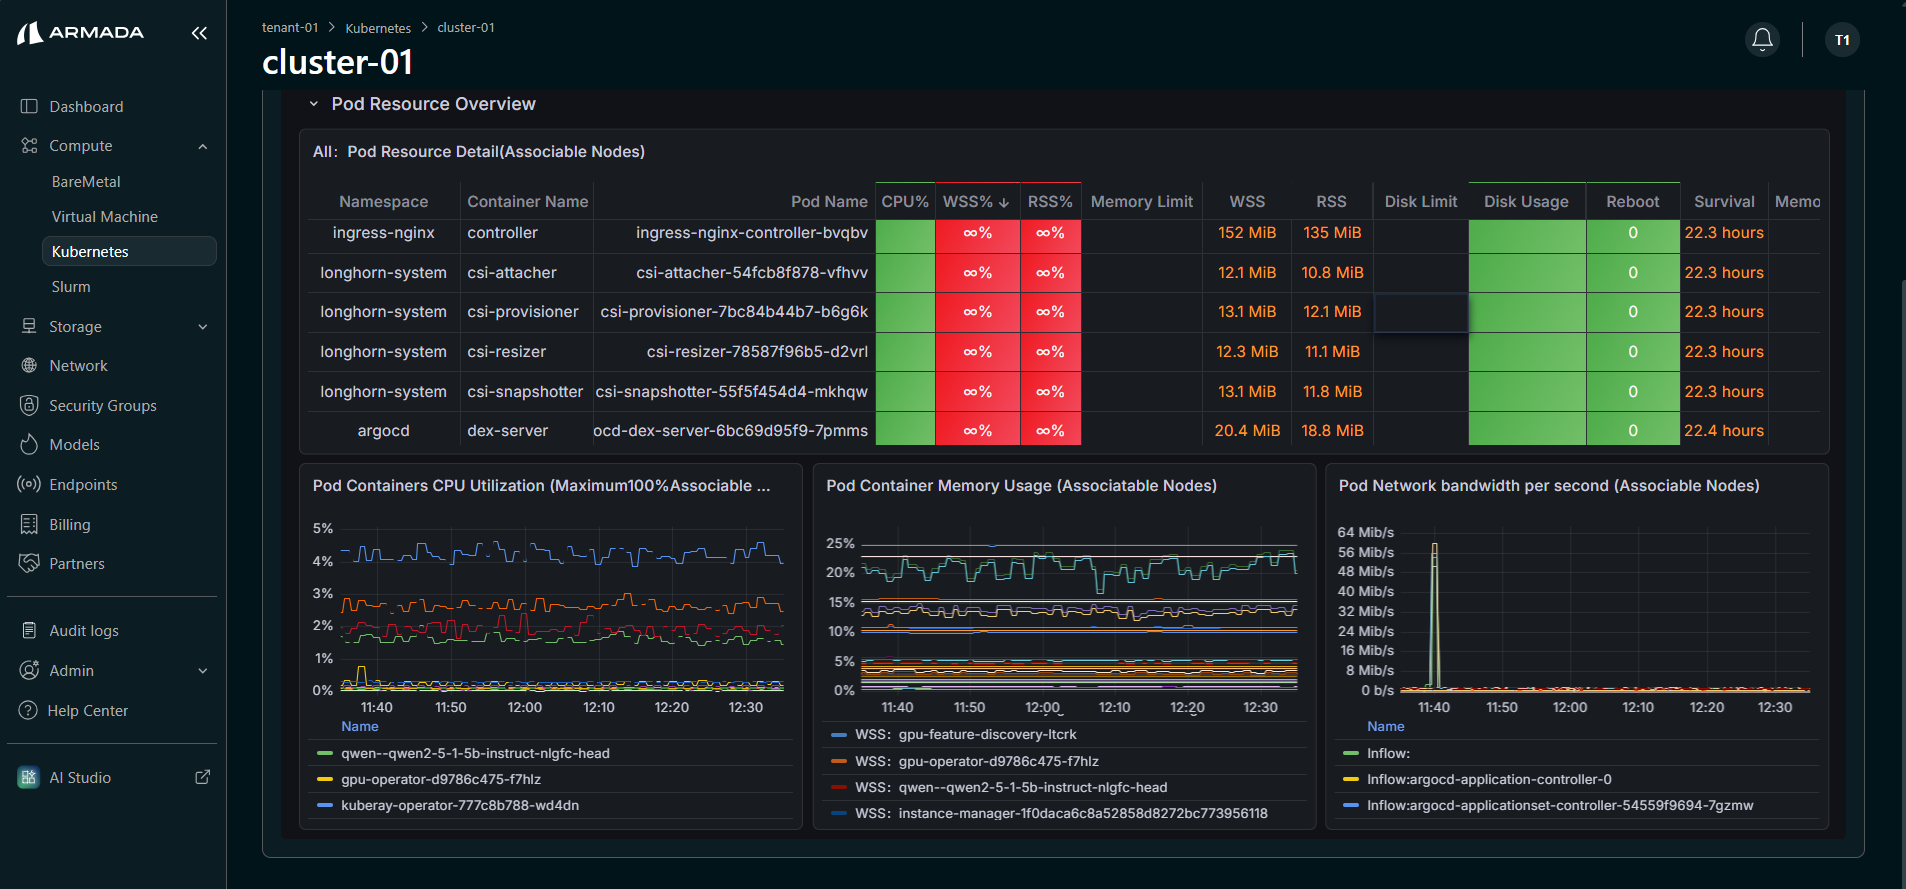
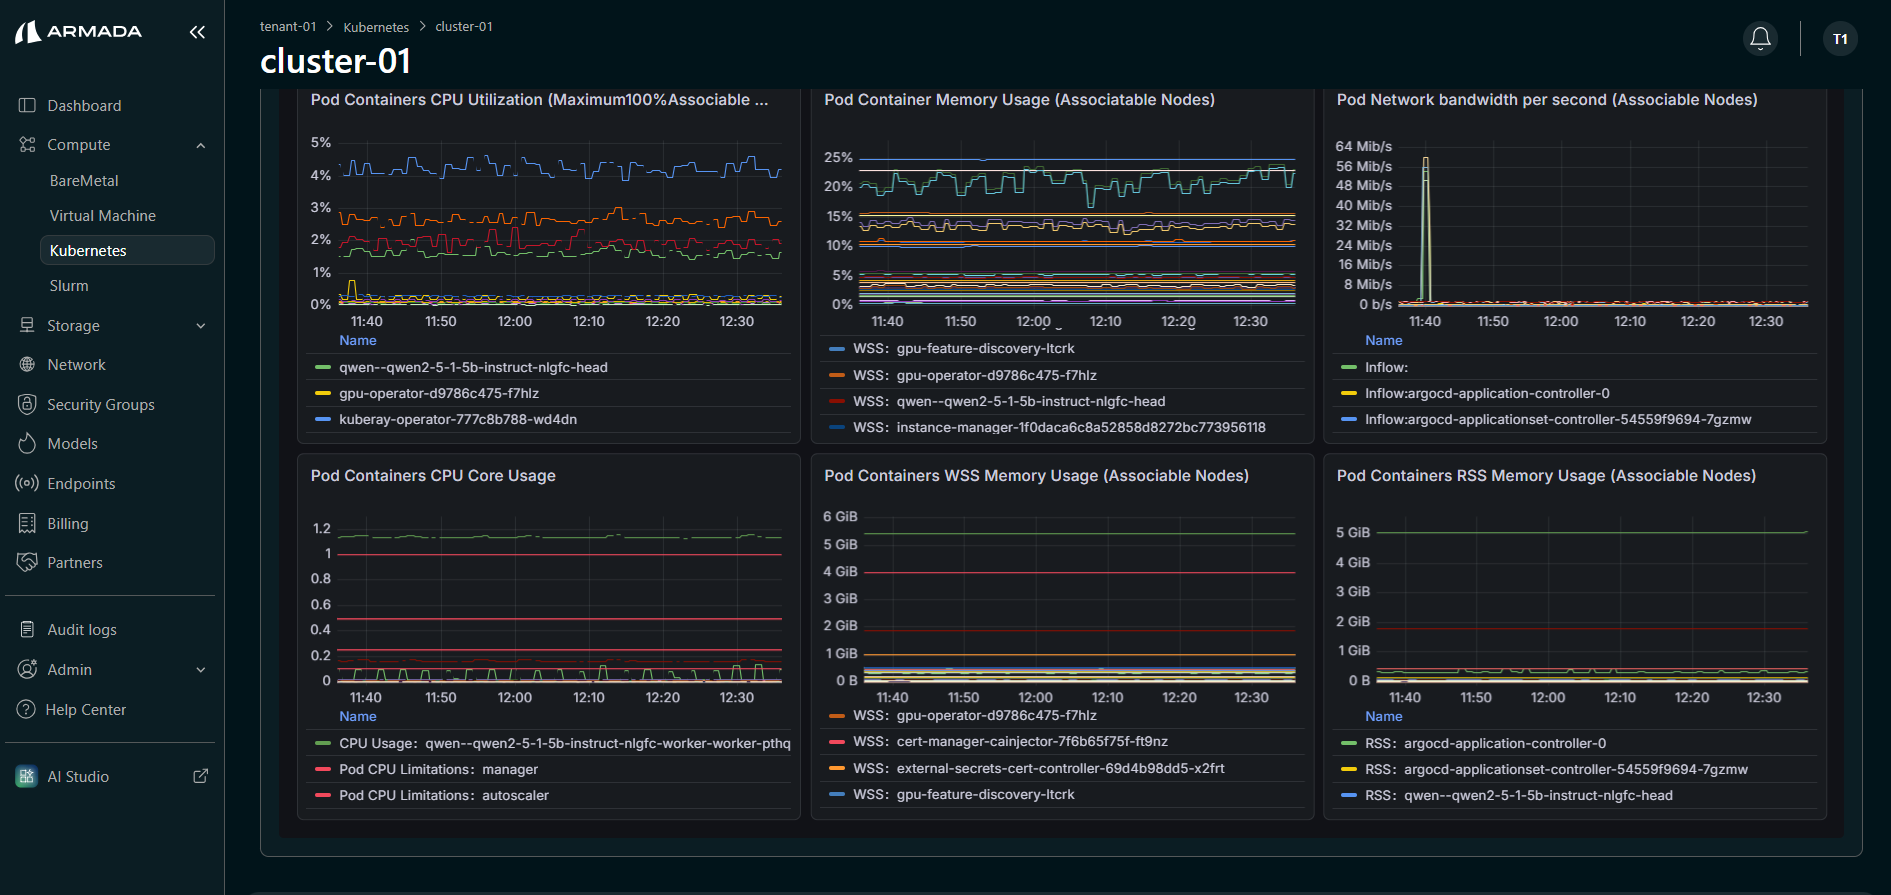
Pod Resource Overview
The Pod Resource Overview panel provides granular visibility into individual pod performance and resource consumption.
Key metrics include:
| Panel | Description |
|---|---|
| Pod Resource Detail | Table listing each pod with Namespace, Container Name, Pod Name, CPU%, WSS%, RSS%, Memory Limit, WSS, RSS, Disk Limit, Disk Usage, Survival time, Requests, and Inflow |
| Pod Containers CPU Utilization | CPU utilization percentage (Maximum 100%) per pod container over time |
| Pod Container Memory Usage | Memory usage per pod container over time |
| Pod Network Bandwidth per Second | Network inflow and outflow bandwidth per pod |
| Pod Containers CPU Core Usage | Actual CPU core consumption per pod container |
| Pod Containers WSS Memory Usage | Working Set Size memory per pod container |
| Pod Containers RSS Memory Usage | Resident Set Size memory per pod container |
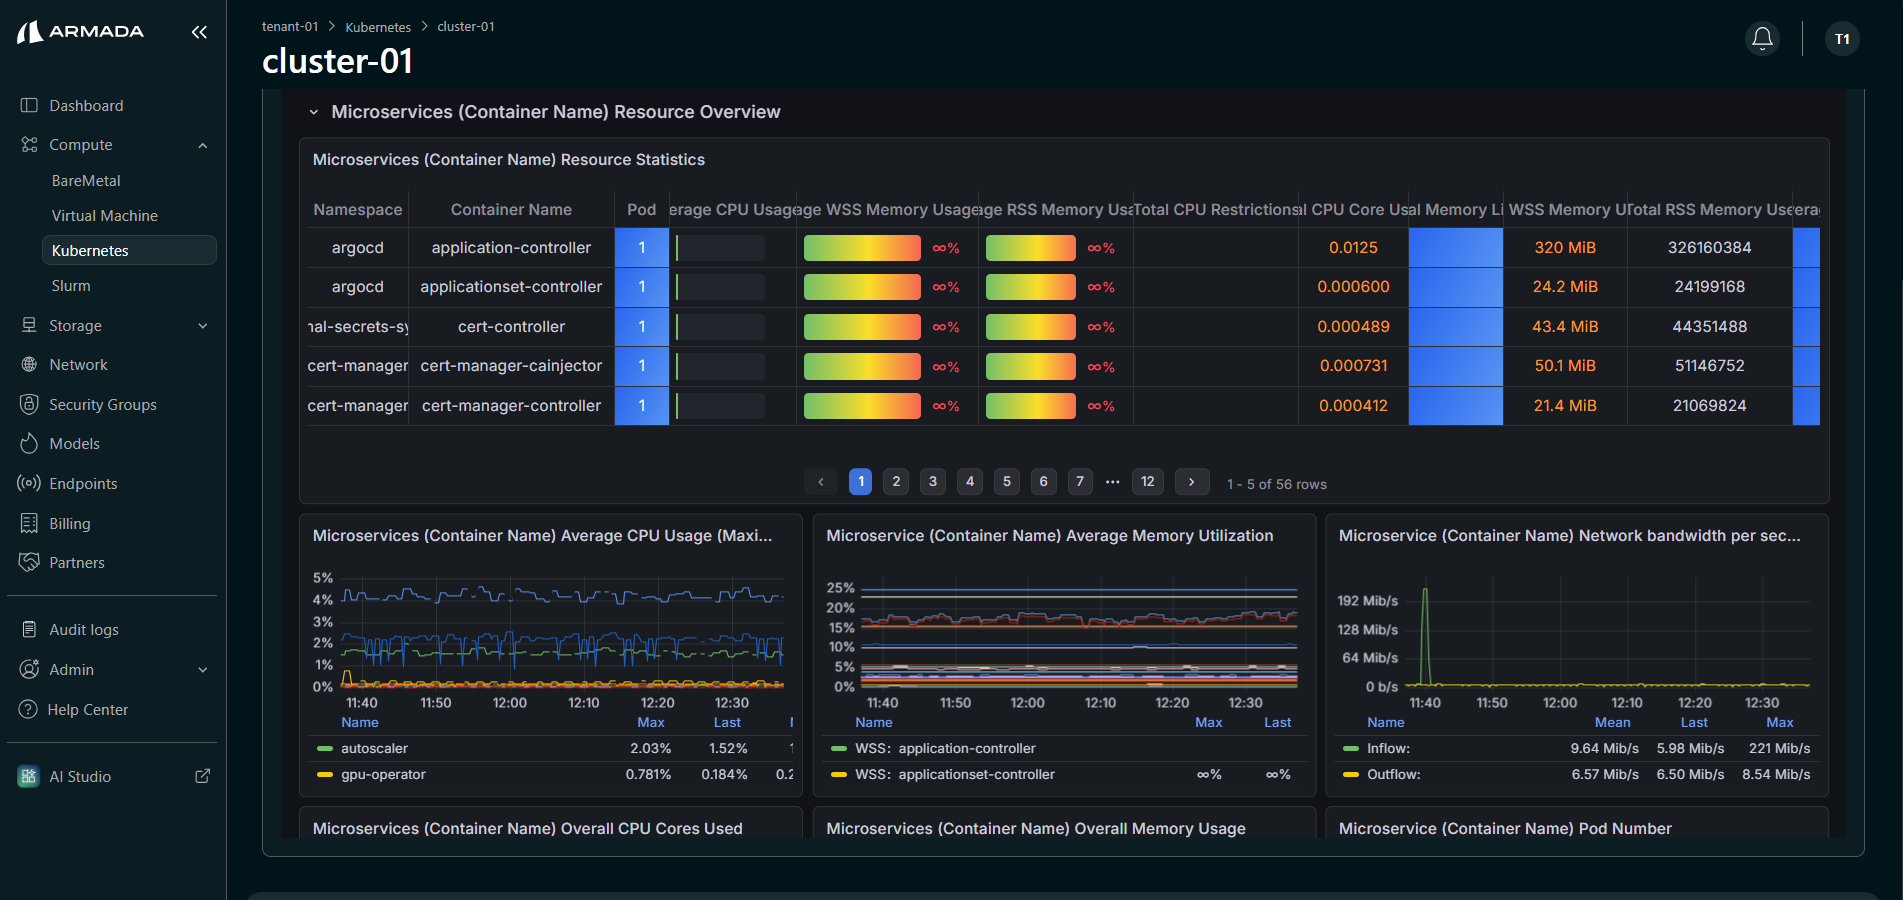
Microservices (Container Name) Resource Overview
The Microservices Resource Overview panel provides container-level metrics, allowing you to monitor individual microservices running within pods.
Key metrics include:
| Panel | Description |
|---|---|
| Resource Statistics | Table listing each container with Namespace, Container Name, Pod count, Average CPU Usage, WSS Memory Usage, RSS Memory Use, Total CPU Restrictions, CPU Core Usage, WSS Memory, Total RSS Memory, Disk Linage, Disk Used, CPU Demand, and Total Memory Requirements |
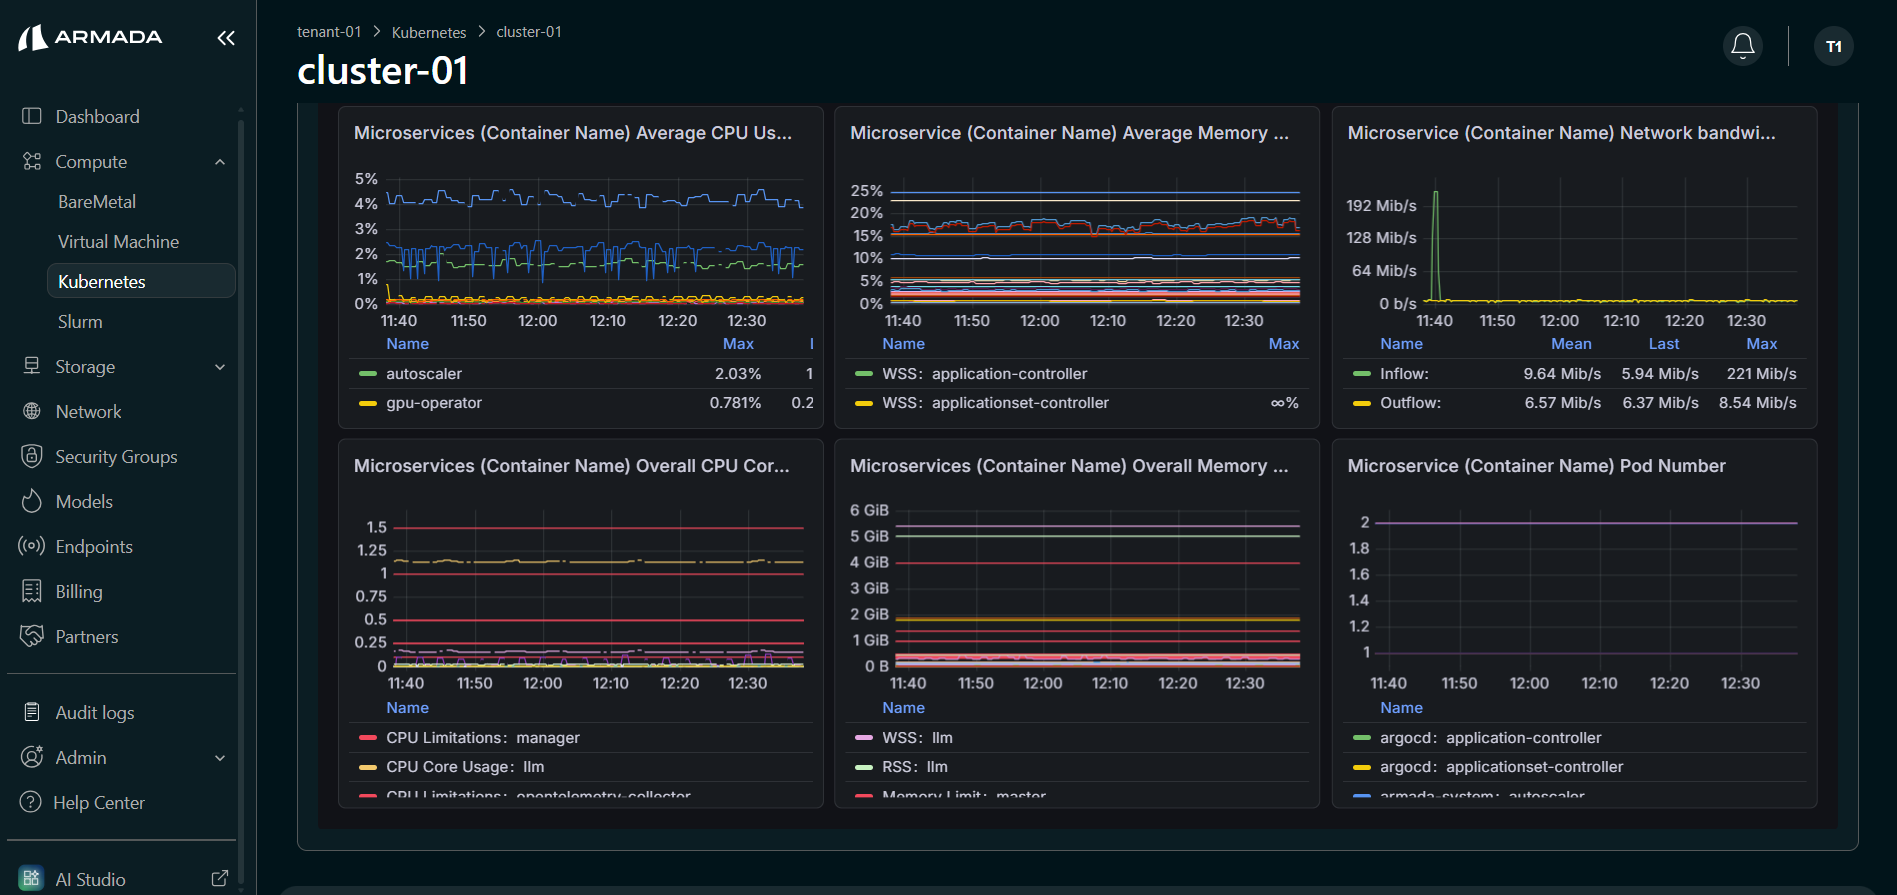
| Average CPU Usage | CPU usage percentage (Maximum 100%) per microservice over time |
| Average Memory Utilization | Memory utilization percentage per microservice over time |
| Network Bandwidth per Second | Network inflow and outflow per microservice |
| Overall CPU Cores Used | Actual CPU core consumption per microservice with limits shown |
| Overall Memory Usage | Memory consumption (WSS and RSS) per microservice |
| Pod Number | Number of pods running for each microservice over time |
Utilization
The Utilization sub-section provides cluster-wide resource utilization metrics through four expandable panels: Overview, Resources, Kubernetes, and Network.
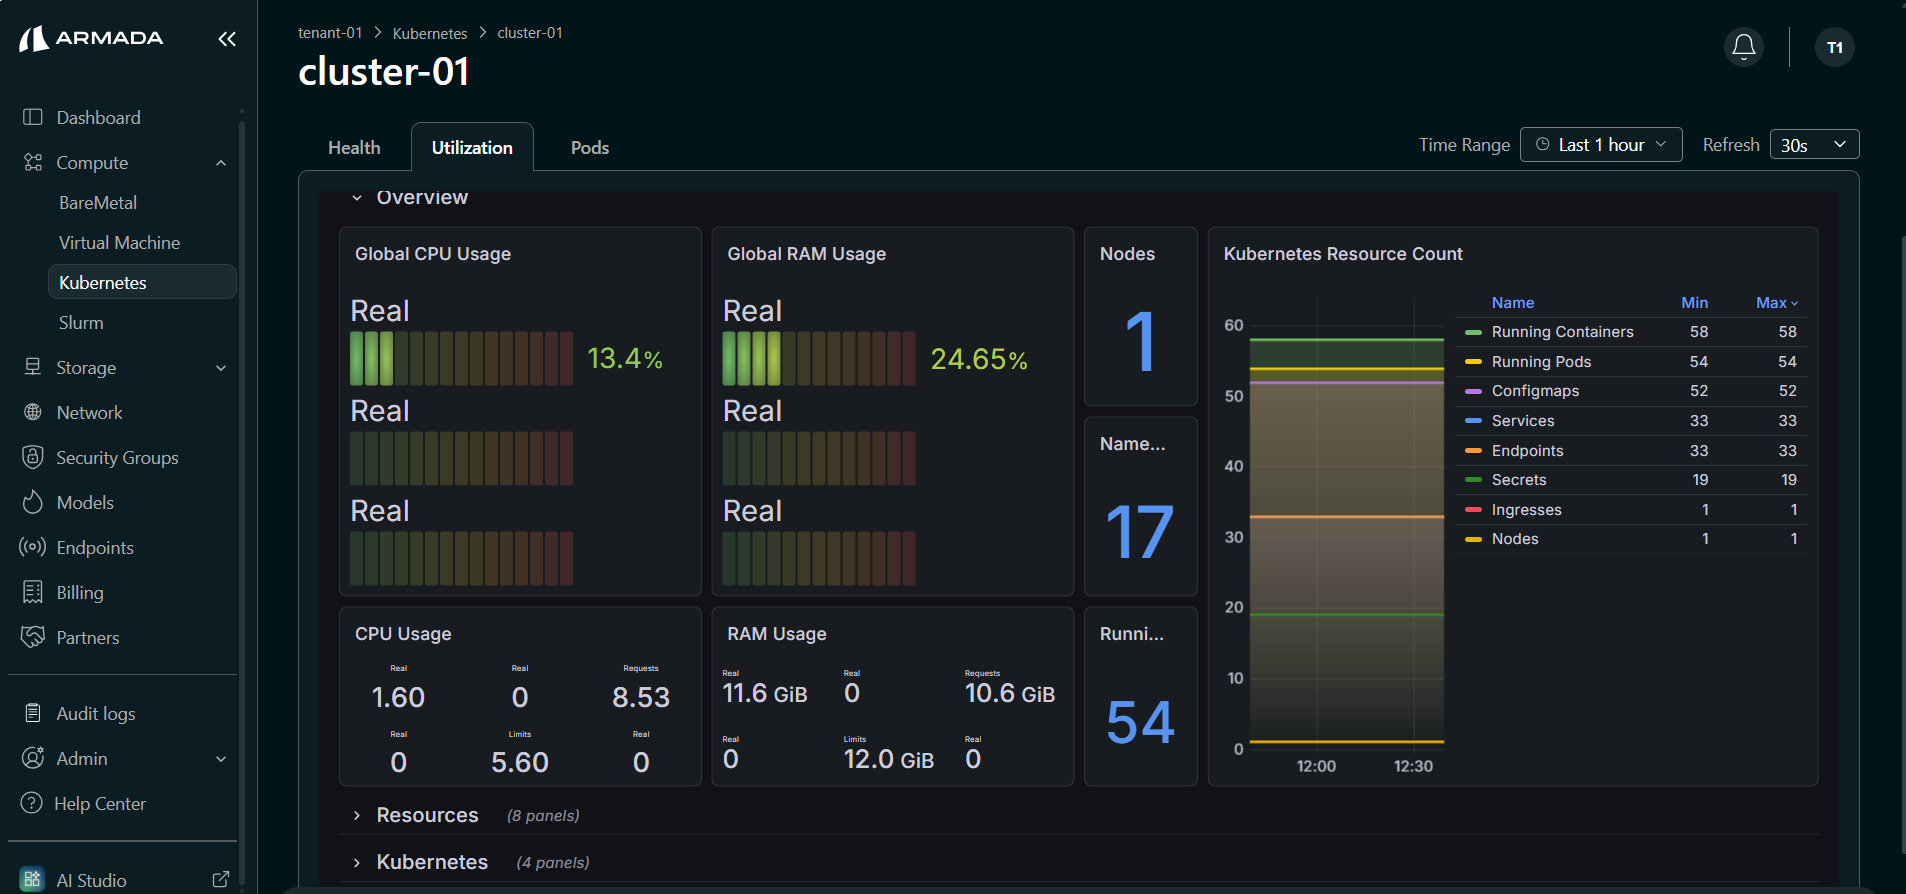
Overview
The Overview panel displays high-level cluster resource consumption at a glance.
Key metrics include:
| Panel | Description |
|---|---|
| Global CPU Usage | Real-time CPU usage percentage across the cluster |
| Global RAM Usage | Real-time RAM usage percentage across the cluster |
| Nodes | Total number of nodes in the cluster |
| Namespaces | Total number of namespaces in the cluster |
| Kubernetes Resource Count | Time-series chart showing counts of Running Containers, Running Pods, ConfigMaps, Services, Endpoints, Secrets, Ingresses, and Nodes |
| CPU Usage | Breakdown of CPU — Real, Requests, Limits values |
| RAM Usage | Breakdown of RAM — Real, Requests, Limits values |
| Running Pods | Total number of currently running pods |
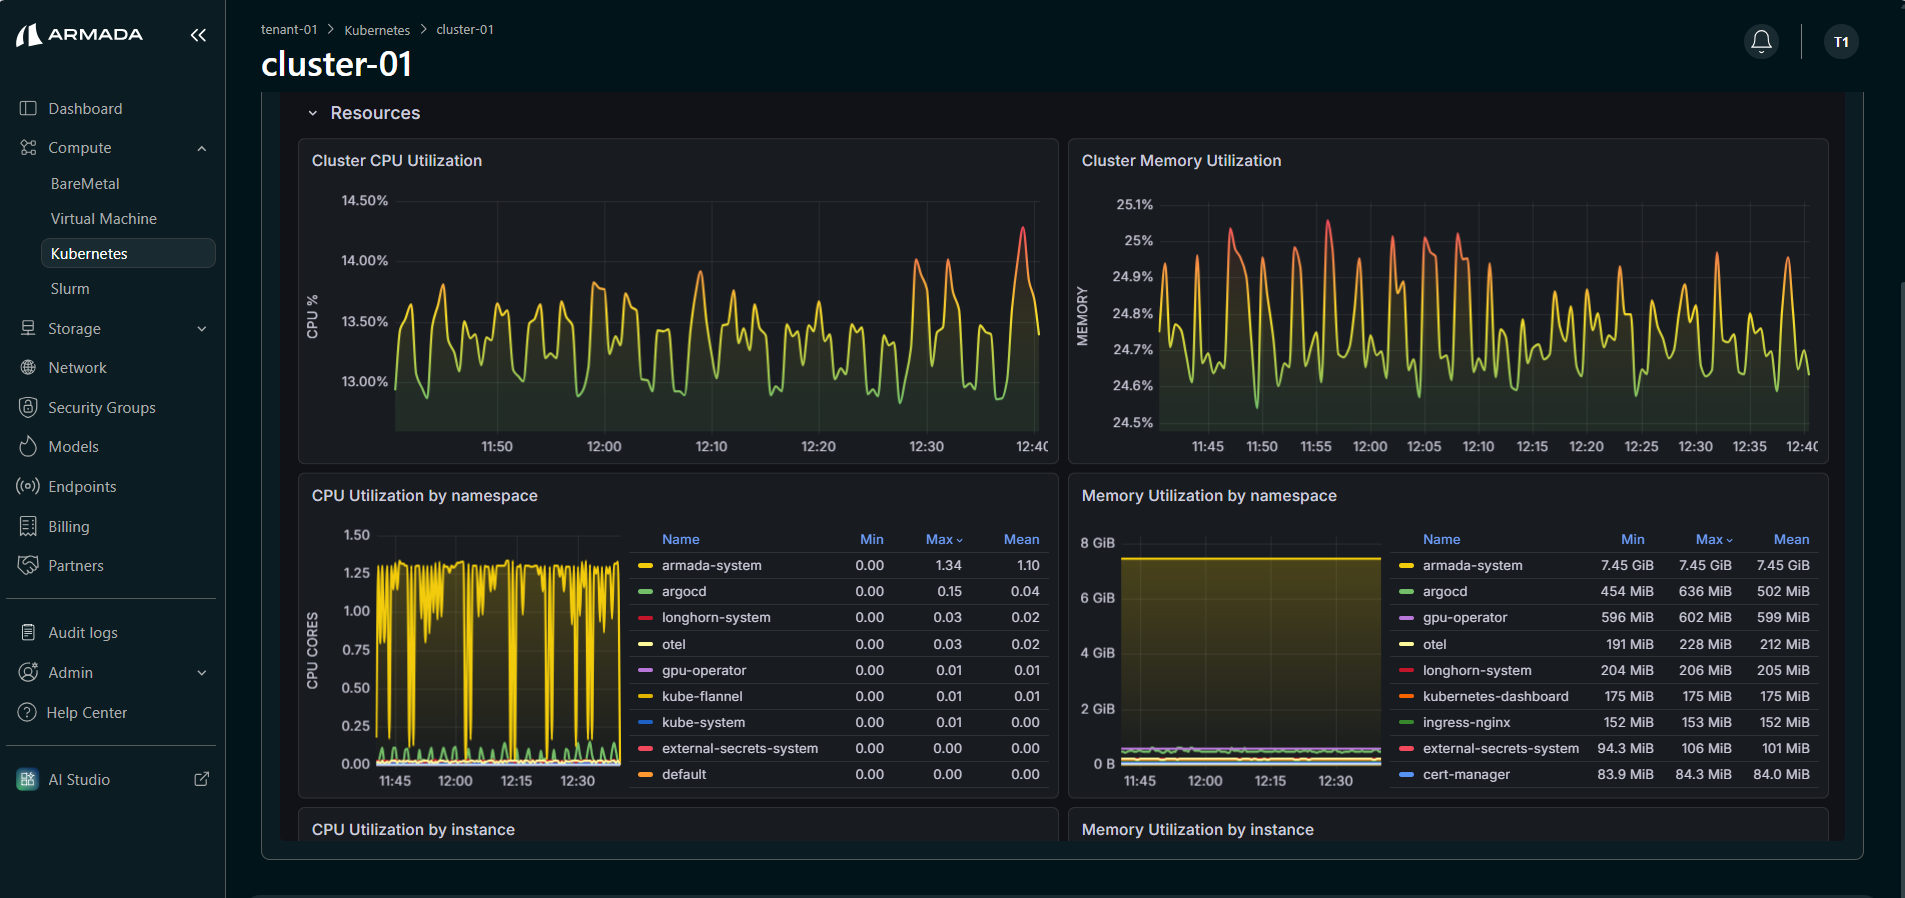
Resources
The Resources panel provides detailed time-series charts for CPU, memory, and related resource utilization across the cluster.
Key metrics include:
| Panel | Description |
|---|---|
| Cluster CPU Utilization | Overall CPU utilization percentage over time |
| Cluster Memory Utilization | Overall memory utilization percentage over time |
| CPU Utilization by Namespace | CPU usage breakdown per namespace over time |
| Memory Utilization by Namespace | Memory usage breakdown per namespace over time |
| CPU Utilization by Instance | CPU usage breakdown per node instance over time |
| Memory Utilization by Instance | Memory usage breakdown per node instance over time |
| CPU Throttled Seconds by Namespace | CPU throttling duration per namespace |
| CPU Data Transmit by Instance | CPU data transmission rate per node instance |
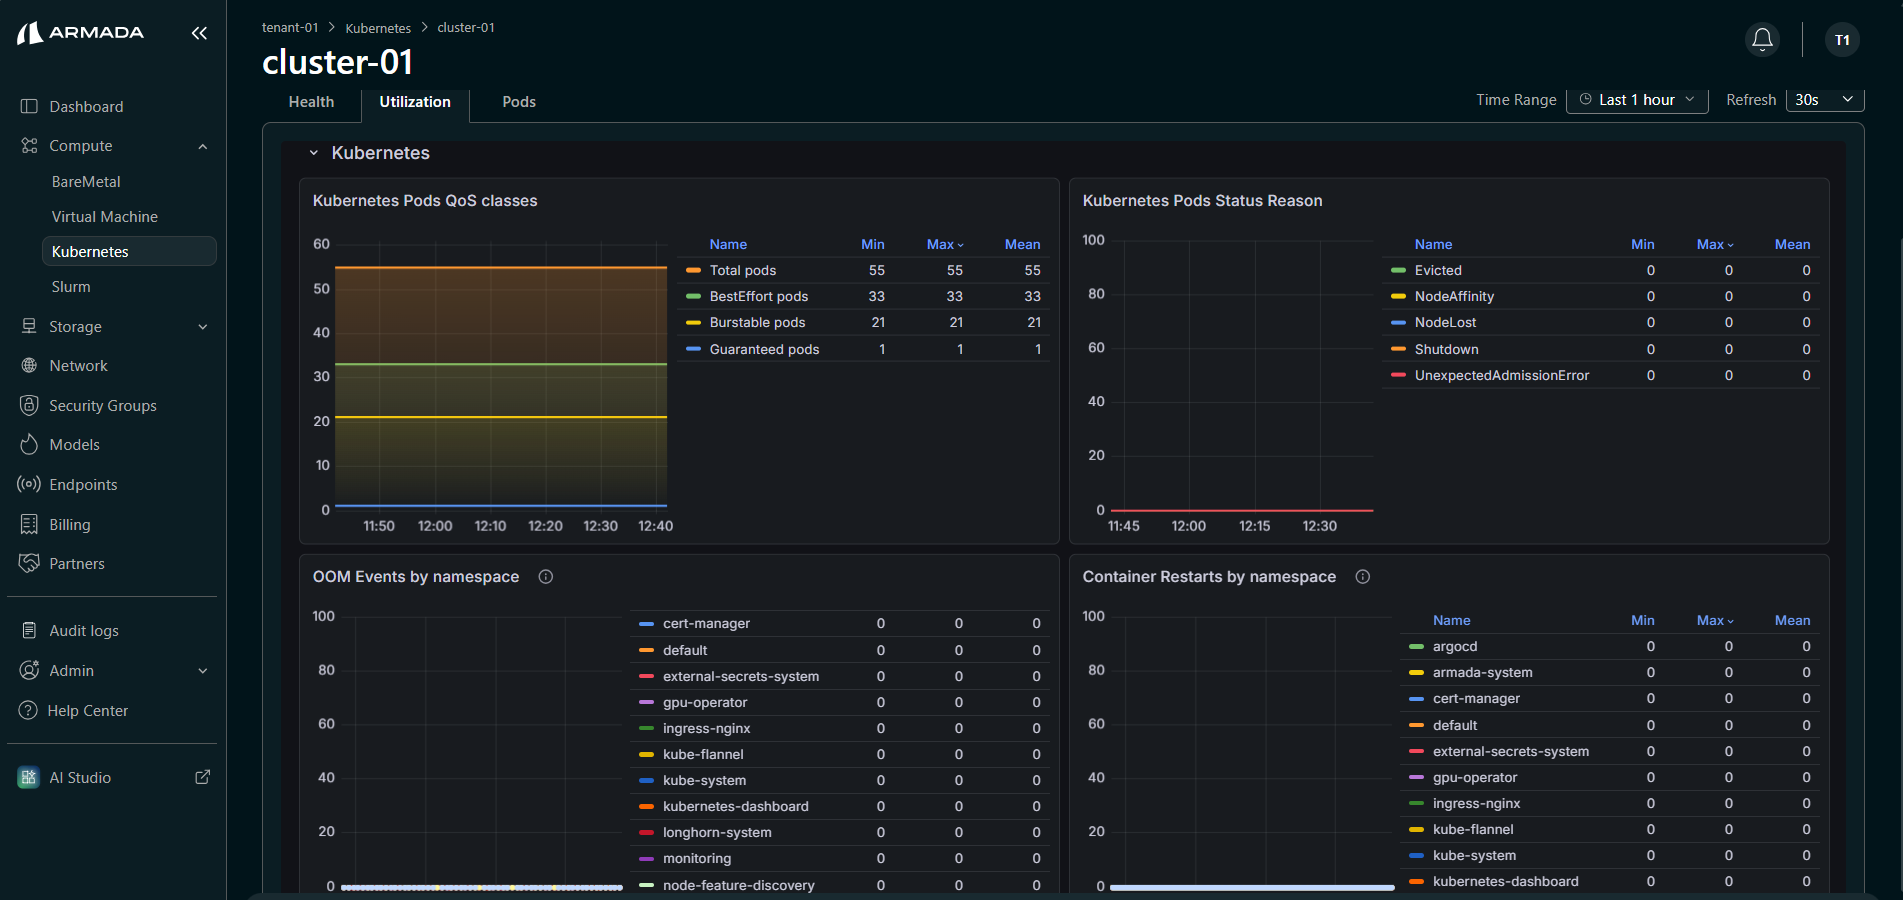
Kubernetes
The Kubernetes panel provides insights into Kubernetes-specific resource states and pod health.
Key metrics include:
| Panel | Description |
|---|---|
| Kubernetes Pods QoS Classes | Breakdown of pods by QoS class — BestEffort, Burstable, Guaranteed — with min, max, and mean counts over time |
| Kubernetes Pods Status Reason | Pod status distribution — Created, NodeAffinity, NodeLost, Shutdown, UnexpectedAdmissionError |
| OOM Events by Namespace | Out-of-Memory kill events per namespace over time |
| Container Restarts by Namespace | Container restart counts per namespace over time |
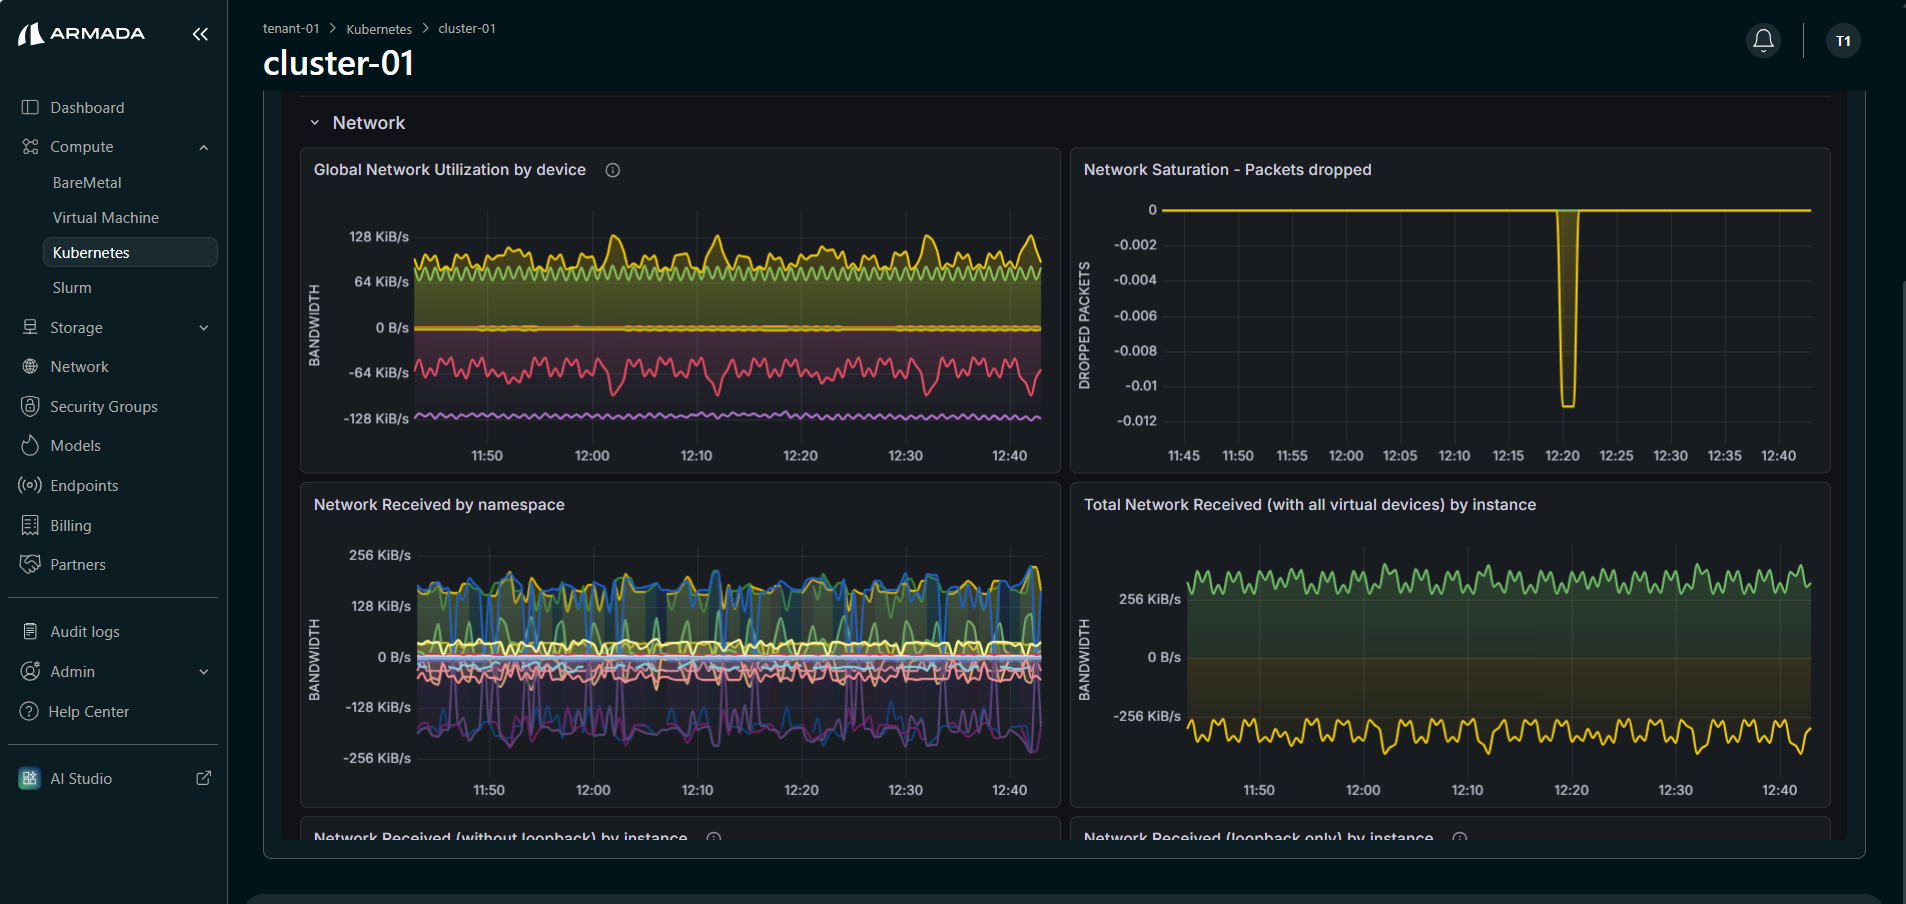
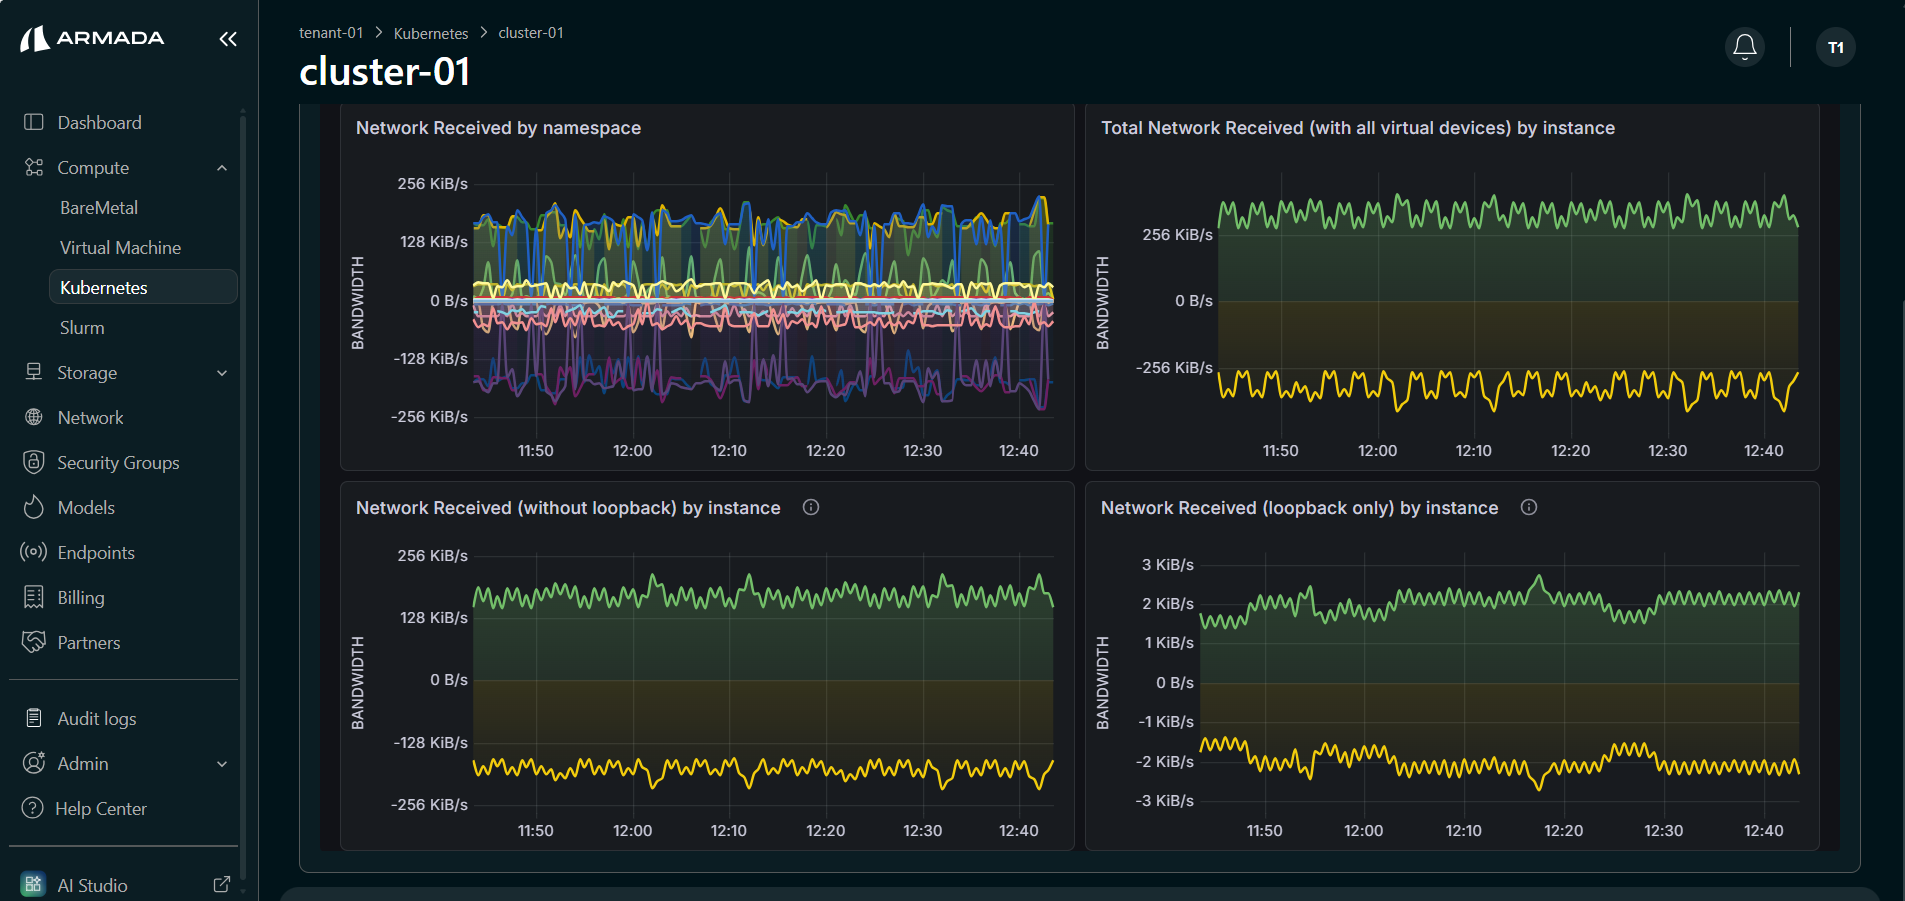
Network
The Network panel provides detailed network traffic and bandwidth metrics across the cluster.
Key metrics include:
| Panel | Description |
|---|---|
| Global Network Utilization by Device | Overall network bandwidth (send/receive) per network device |
| Network Saturation - Packets Dropped | Dropped packet counts indicating network saturation |
| Network Received by Namespace | Inbound network traffic per namespace |
| Total Network Received (with all virtual devices) by Instance | Total inbound traffic per node instance including virtual devices |
| Network Received (without loopback) by Instance | Inbound traffic per node instance excluding loopback |
| Network Received (loopback only) by Instance | Loopback-only inbound traffic per node instance |
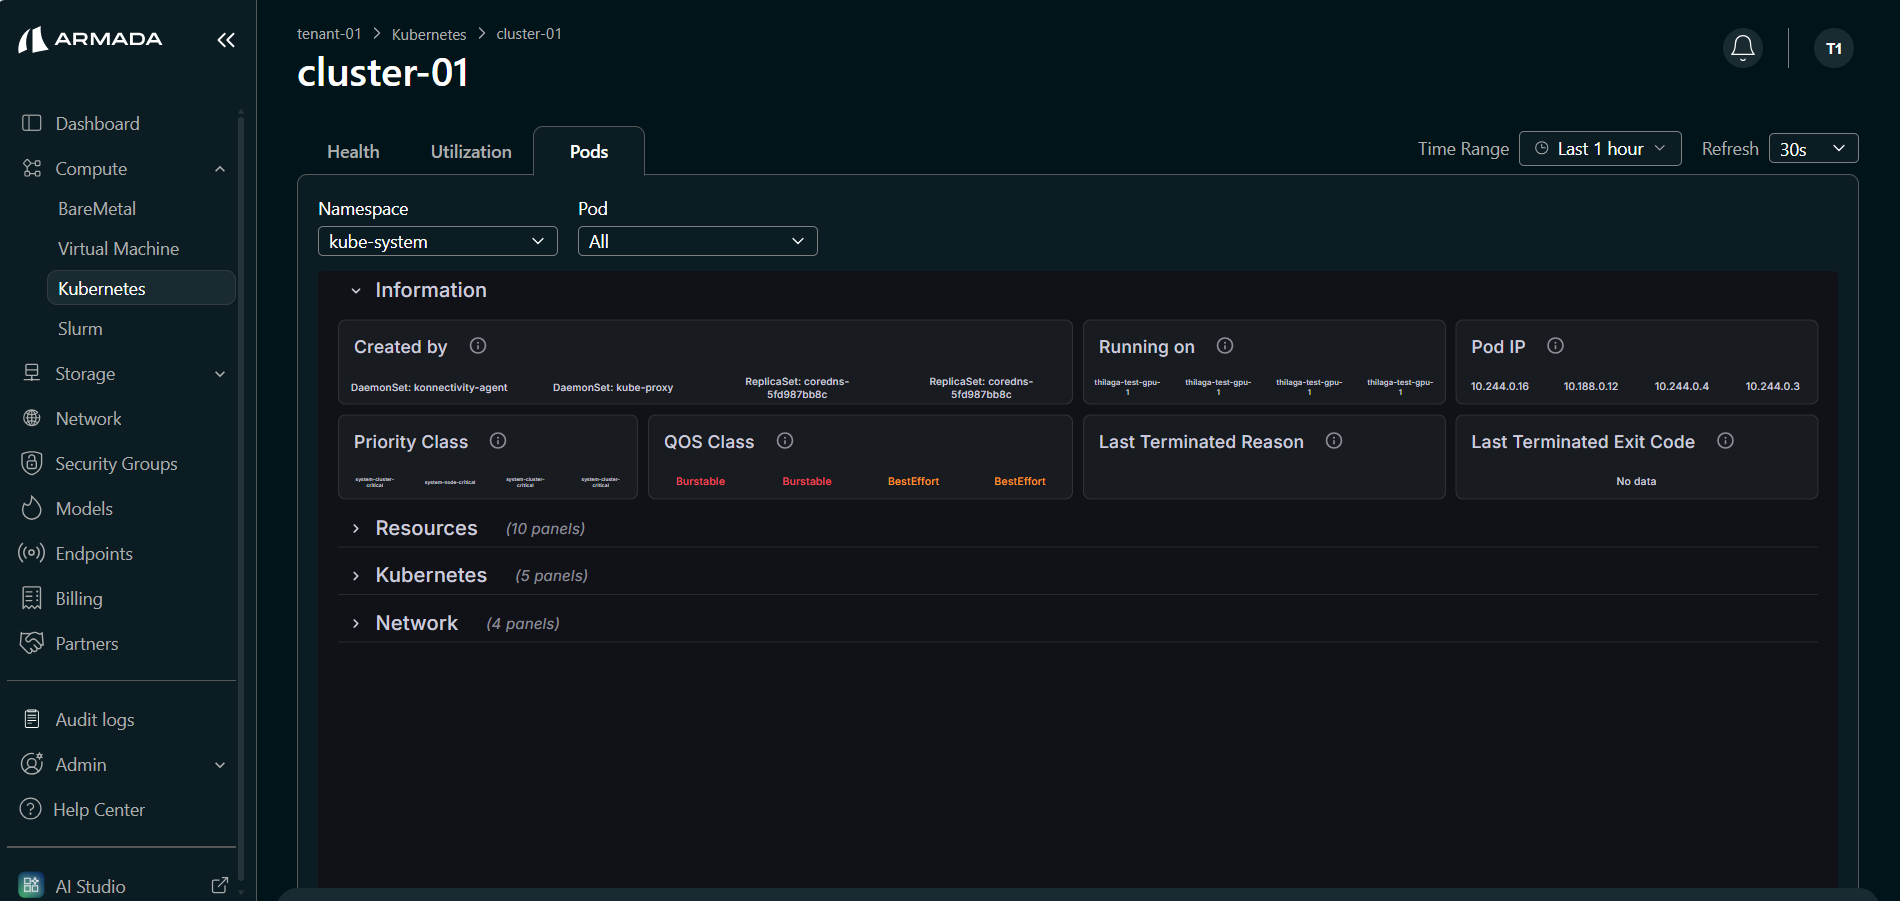
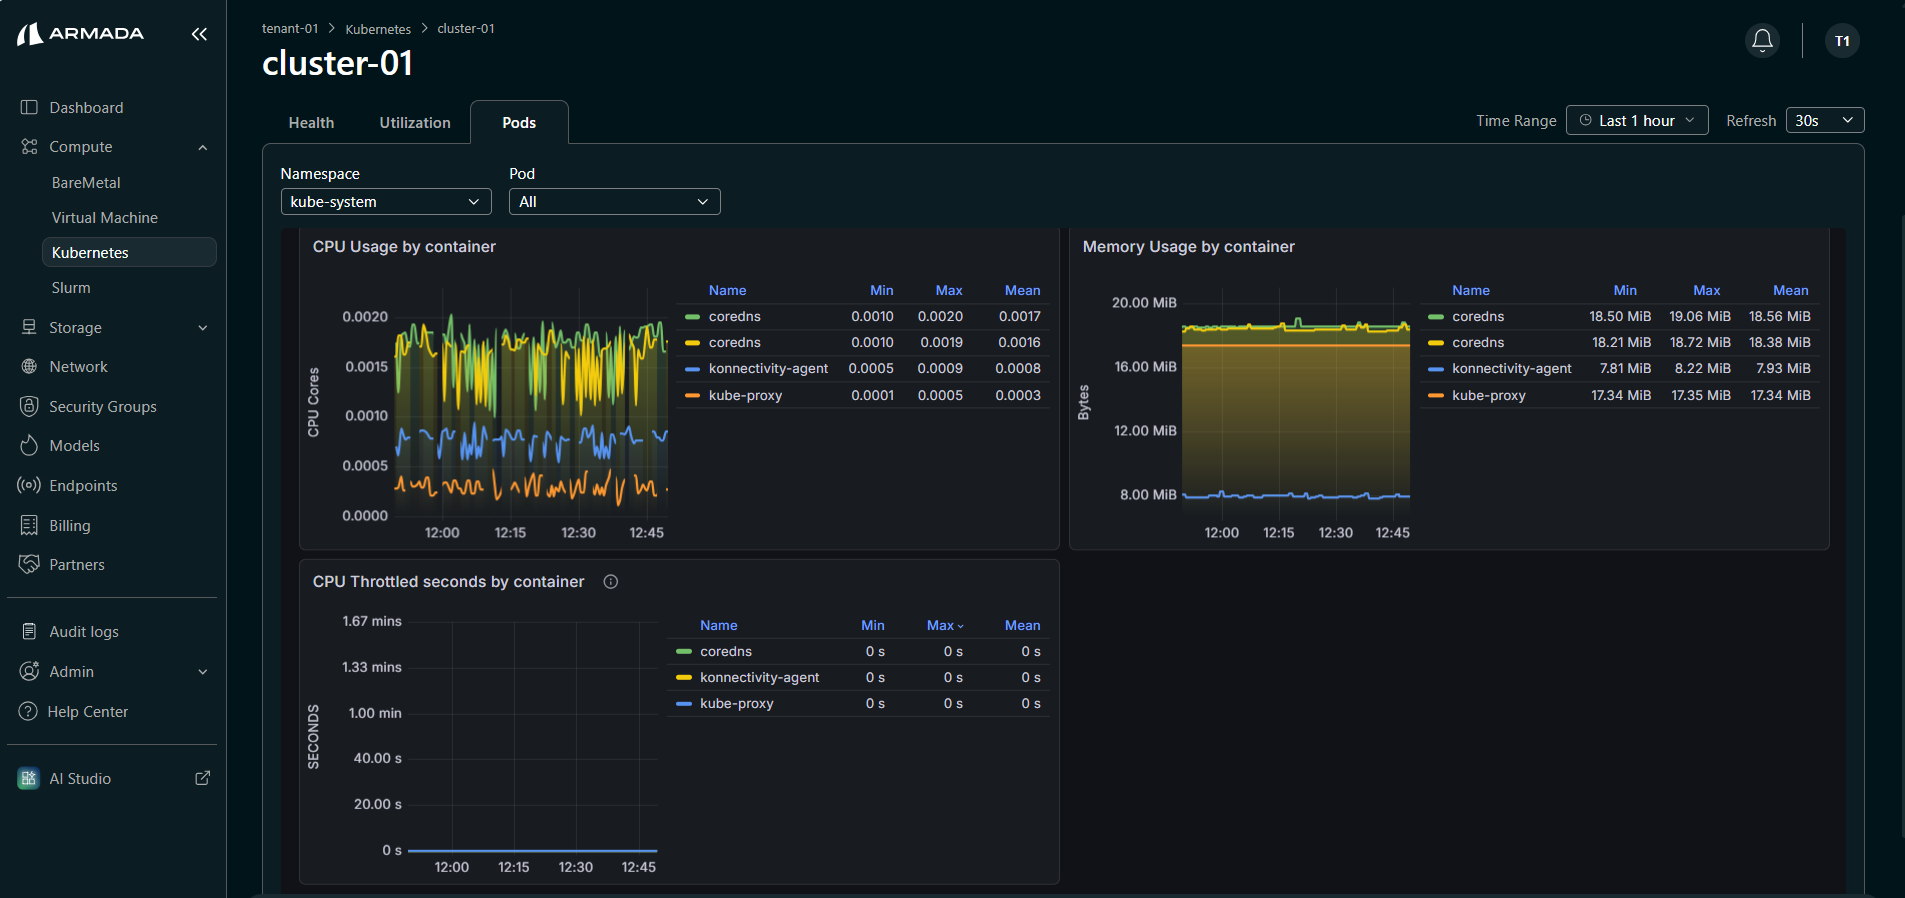
Pods
The Pods sub-section provides pod-level observability scoped to a specific namespace and pod. Use the Namespace and Pod dropdowns at the top to filter the view. It contains four expandable panels: Information, Resources, Kubernetes, and Network.
Information
The Information panel provides metadata and classification details for the selected pods.
Key metrics include:
| Panel | Description |
|---|---|
| Created by | The controller or resource that created the pods (e.g., DaemonSet, ReplicaSet) |
| Running on | The node(s) where the pods are currently running |
| Pod IP | The IP addresses assigned to each pod |
| Priority Class | The priority class assigned to each pod |
| QOS Class | The Quality of Service class for each pod (BestEffort, Burstable, Guaranteed) |
| Last Terminated Reason | The reason for the last pod termination, if applicable |
| Last Terminated Exit Code | The exit code from the last terminated container |
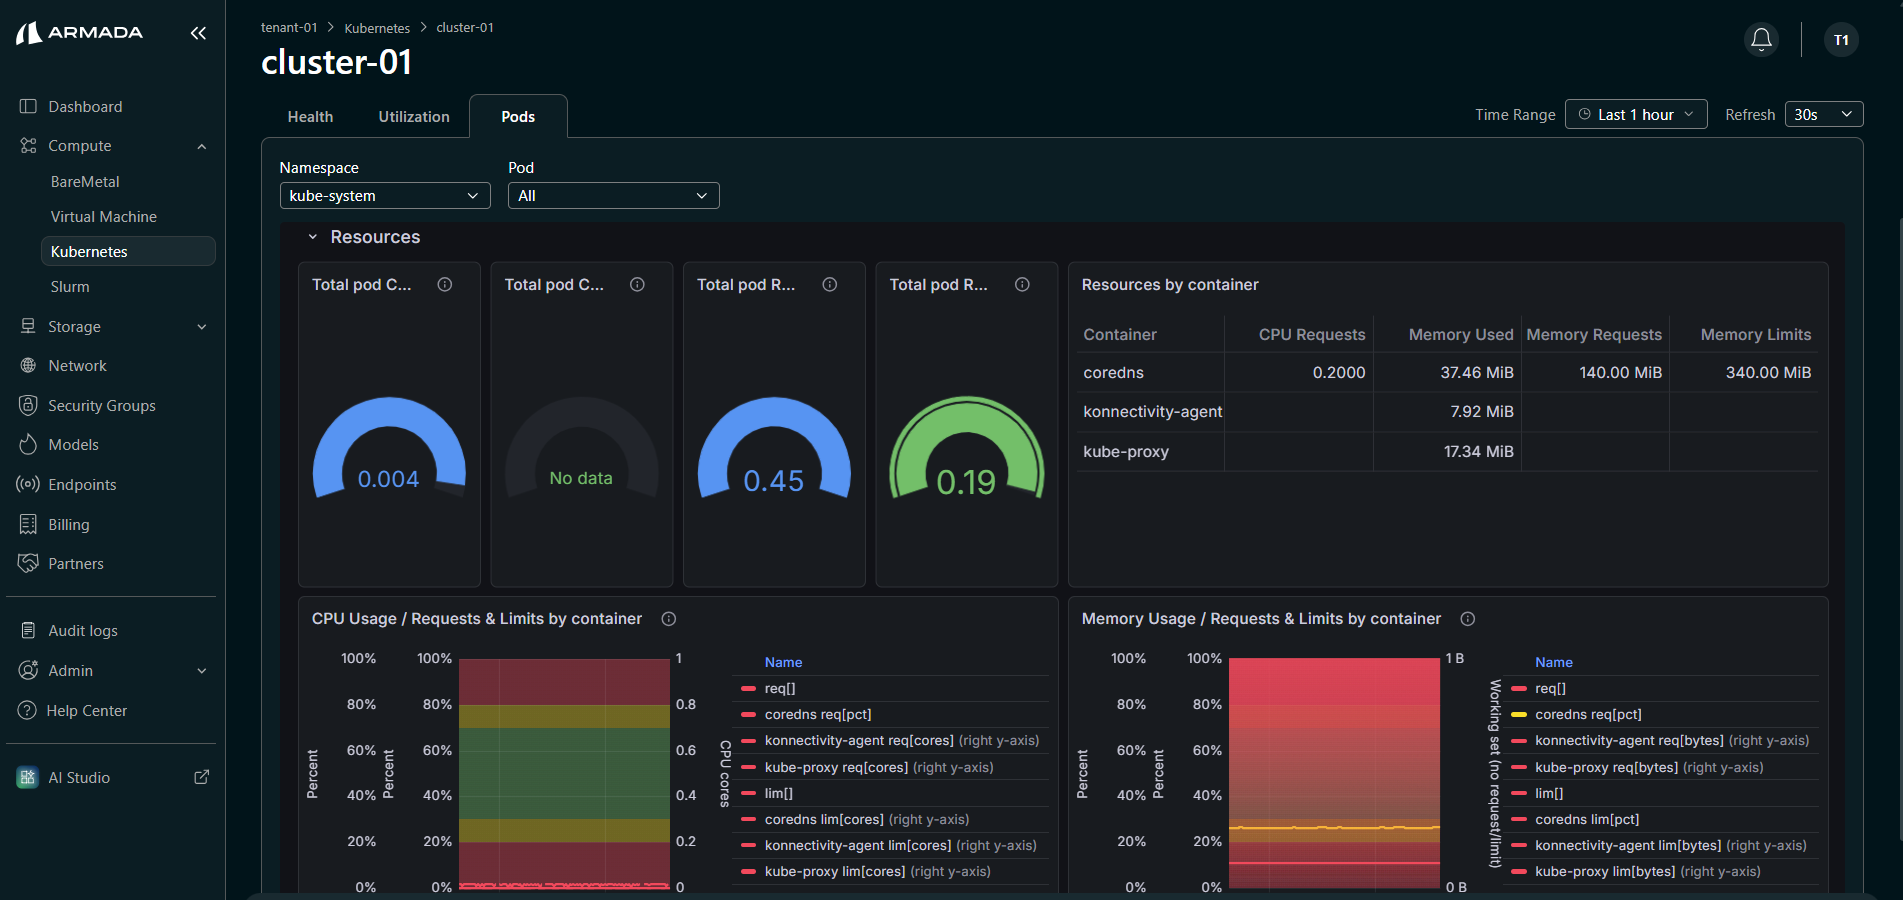
Resources
The Resources panel provides detailed CPU, memory, and resource consumption metrics for the selected pods.
Key metrics include:
| Panel | Description |
|---|---|
| Total pod CPU request/usage | Gauge showing actual CPU usage vs. requested CPU |
| Total pod CPU limits/usage | Gauge showing actual CPU usage vs. CPU limits |
| Total pod RAM request/usage | Gauge showing actual RAM usage vs. requested RAM |
| Total pod RAM limits/usage | Gauge showing actual RAM usage vs. RAM limits |
| Resources by Container | Table with per-container CPU Requests, Memory Count, Memory Requests, and Memory Limits |
| CPU Usage / Requests & Limits by Container | Stacked time-series chart of CPU usage, requests, and limits per container |
| Memory Usage / Requests & Limits by Container | Stacked time-series chart of memory usage, requests, and limits per container |
| CPU Usage by Container | CPU core usage per container over time |
| Memory Usage by Container | Memory consumption per container over time |
| CPU Throttled Seconds by Container | CPU throttling duration per container over time |
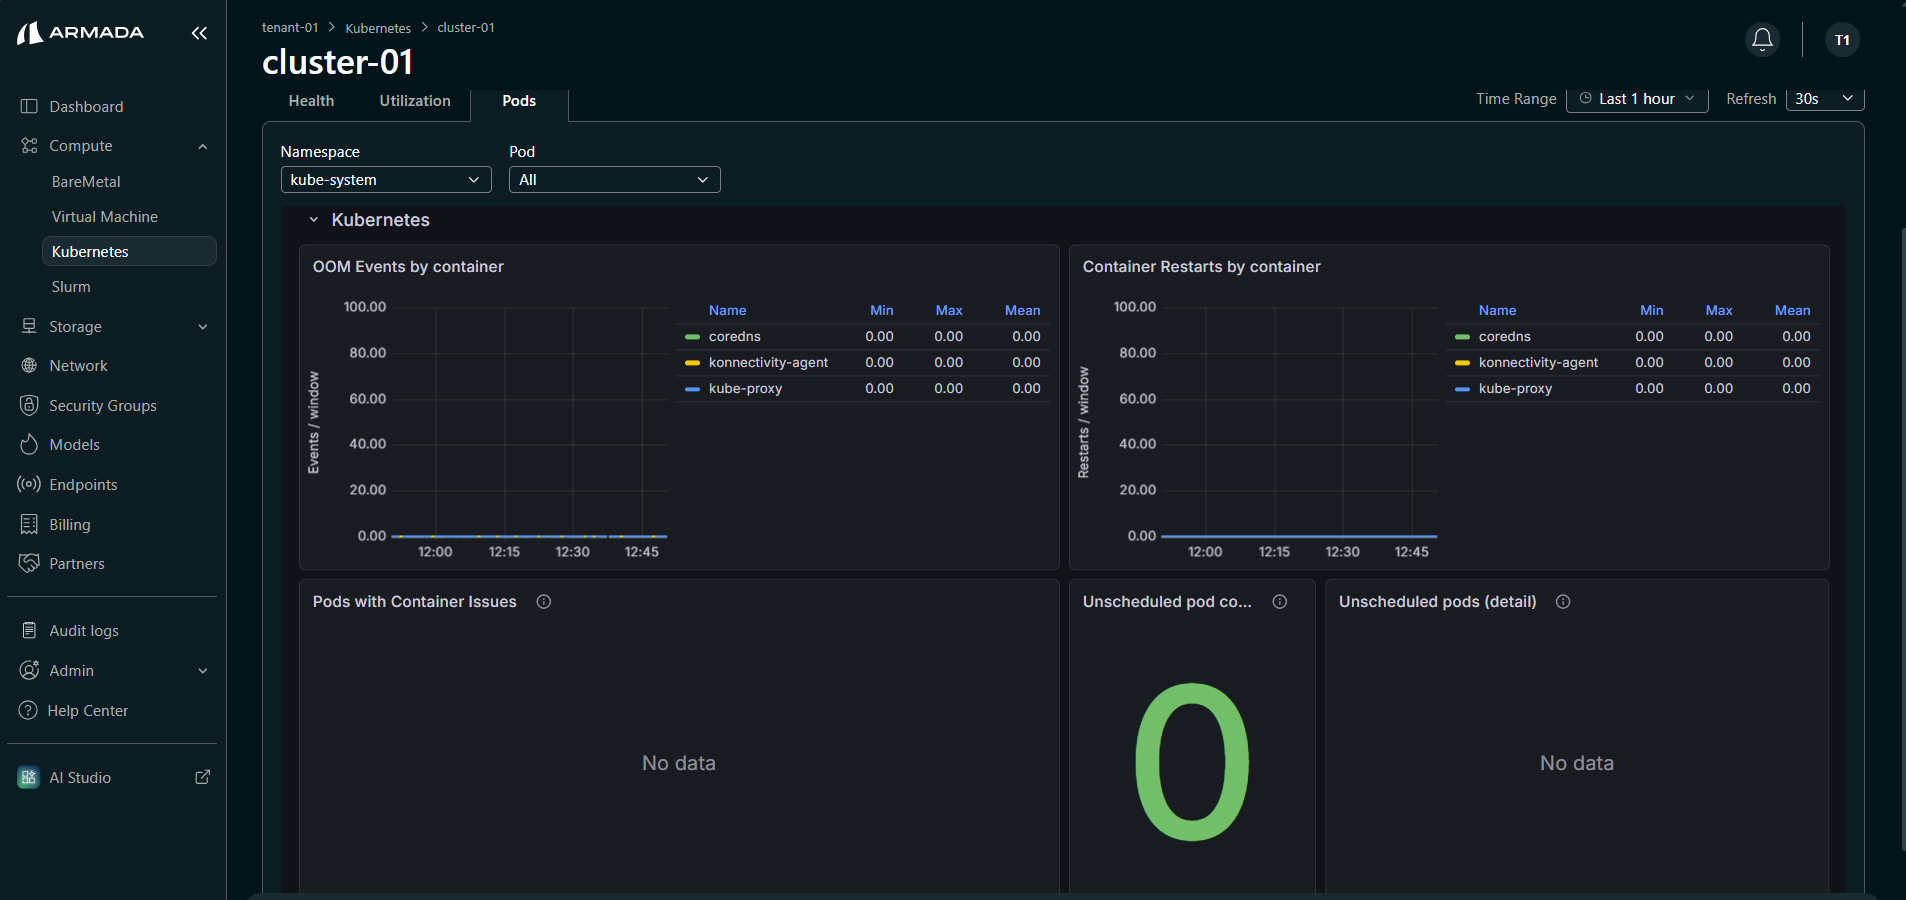
Kubernetes
The Kubernetes panel provides Kubernetes-specific health and scheduling metrics for the selected pods.
Key metrics include:
| Panel | Description |
|---|---|
| OOM Events by Container | Out-of-Memory kill events per container over time |
| Container Restarts by Container | Container restart counts per container over time |
| Pods with Container Issues | Pods experiencing container-level issues |
| Unscheduled Pod Count | Number of pods that could not be scheduled |
| Unscheduled Pods (detail) | Details of pods that failed scheduling |
Network
The Network panel provides network traffic metrics for the selected pods.
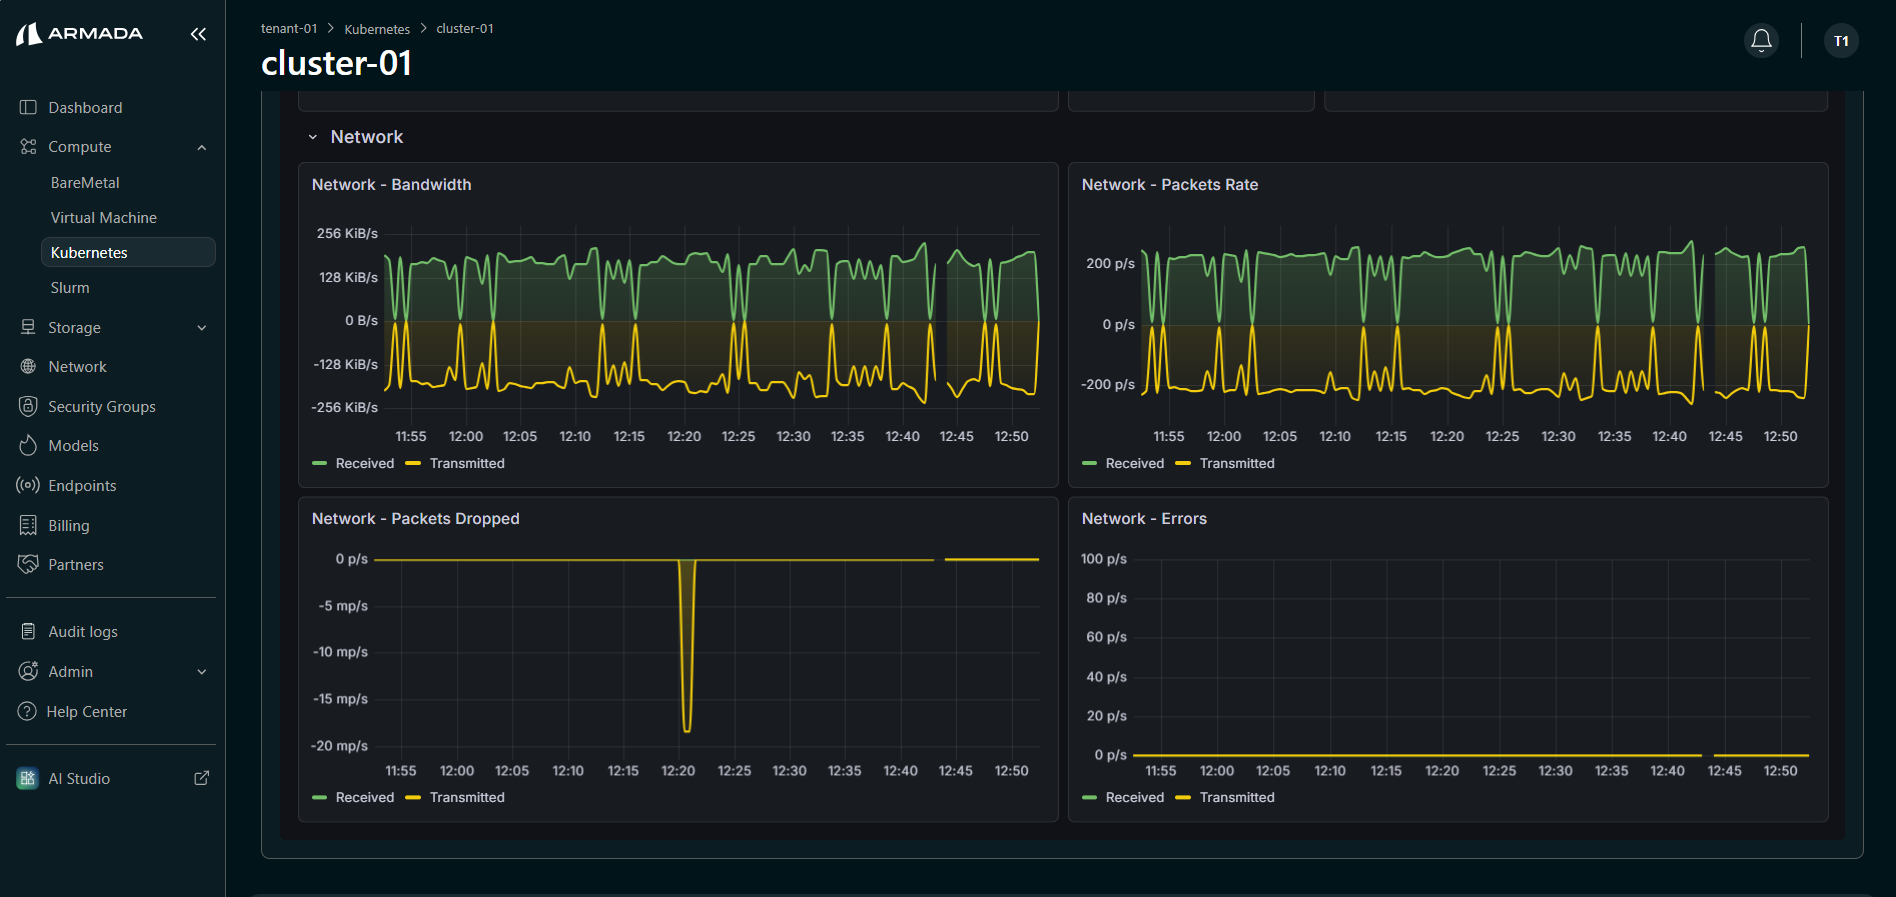
Key metrics include:
| Panel | Description |
|---|---|
| Network - Bandwidth | Network bandwidth (received and transmitted) over time |
| Network - Packets Rate | Packet rate (received and transmitted) over time |
| Network - Packets Dropped | Dropped packets (received and transmitted) over time |
| Network - Errors | Network errors (received and transmitted) over time |
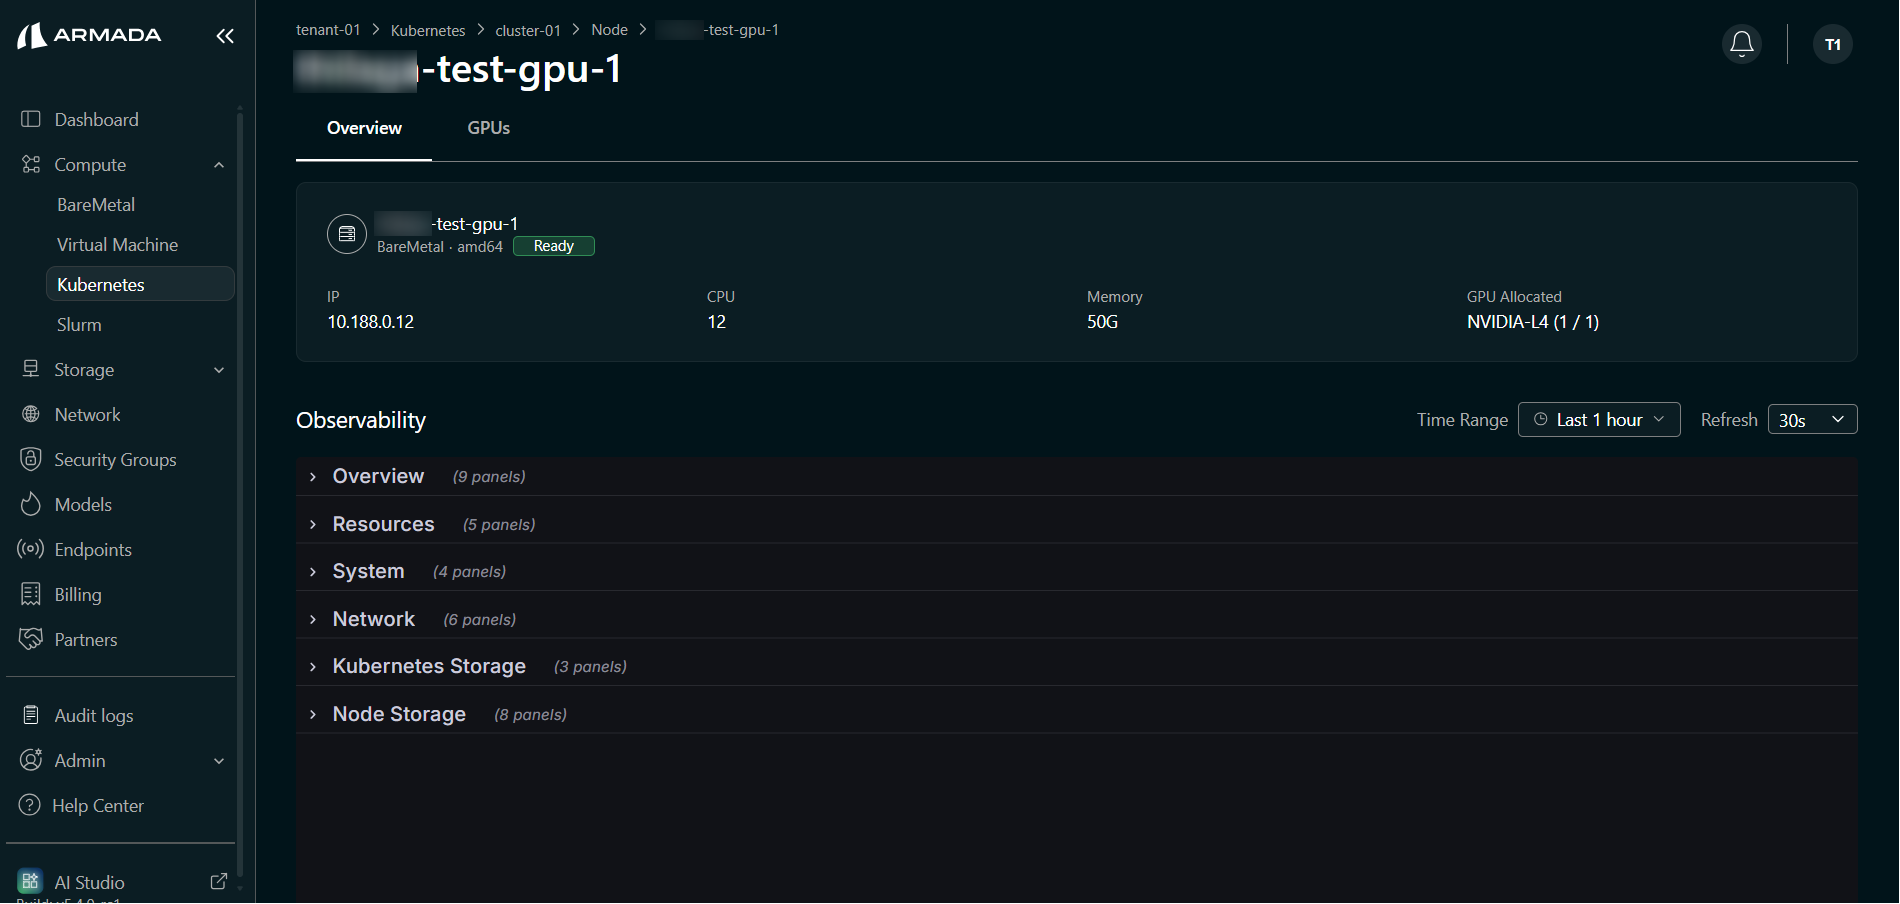
Node Level Observability
Node Observability provides detailed monitoring for individual nodes in your cluster. You can access it from the Nodes tab in the cluster detail view.
Accessing Node Level Observability
- From the cluster detail view, click the Nodes tab.
- Click on the node name to open the node detail page.
- The node detail page displays node metadata (IP, CPU, Memory, GPU Allocated) and an Observability section with six expandable panels: Overview, Resources, System, Network, Kubernetes Storage, and Node Storage.
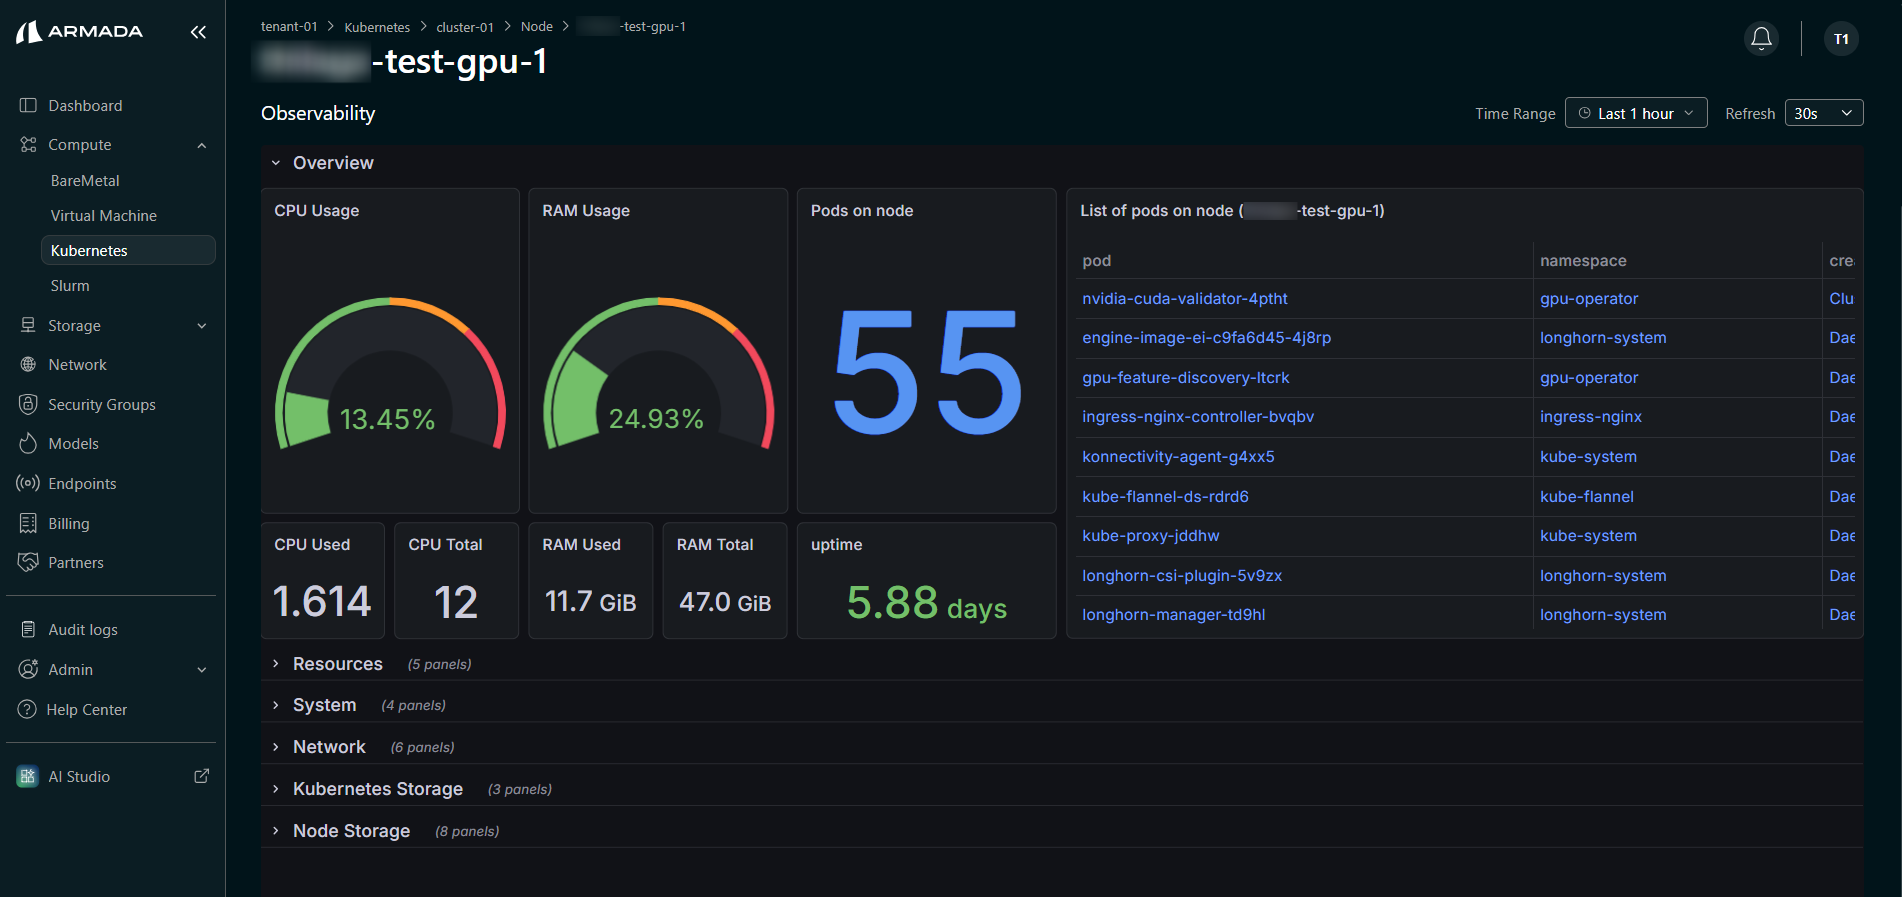
Overview
The Overview panel displays high-level resource consumption and pod information for the selected node.
Key metrics include:
| Panel | Description |
|---|---|
| CPU Usage | Gauge showing current CPU usage percentage on the node |
| RAM Usage | Gauge showing current RAM usage percentage on the node |
| Pods on Node | Total number of pods running on the node |
| CPU Used / CPU Total | Actual CPU cores used vs. total available |
| RAM Used / RAM Total | Actual RAM used vs. total available |
| Uptime | How long the node has been running |
| List of Pods on Node | Table listing all pods on the node with pod name, namespace, and created_by kind |
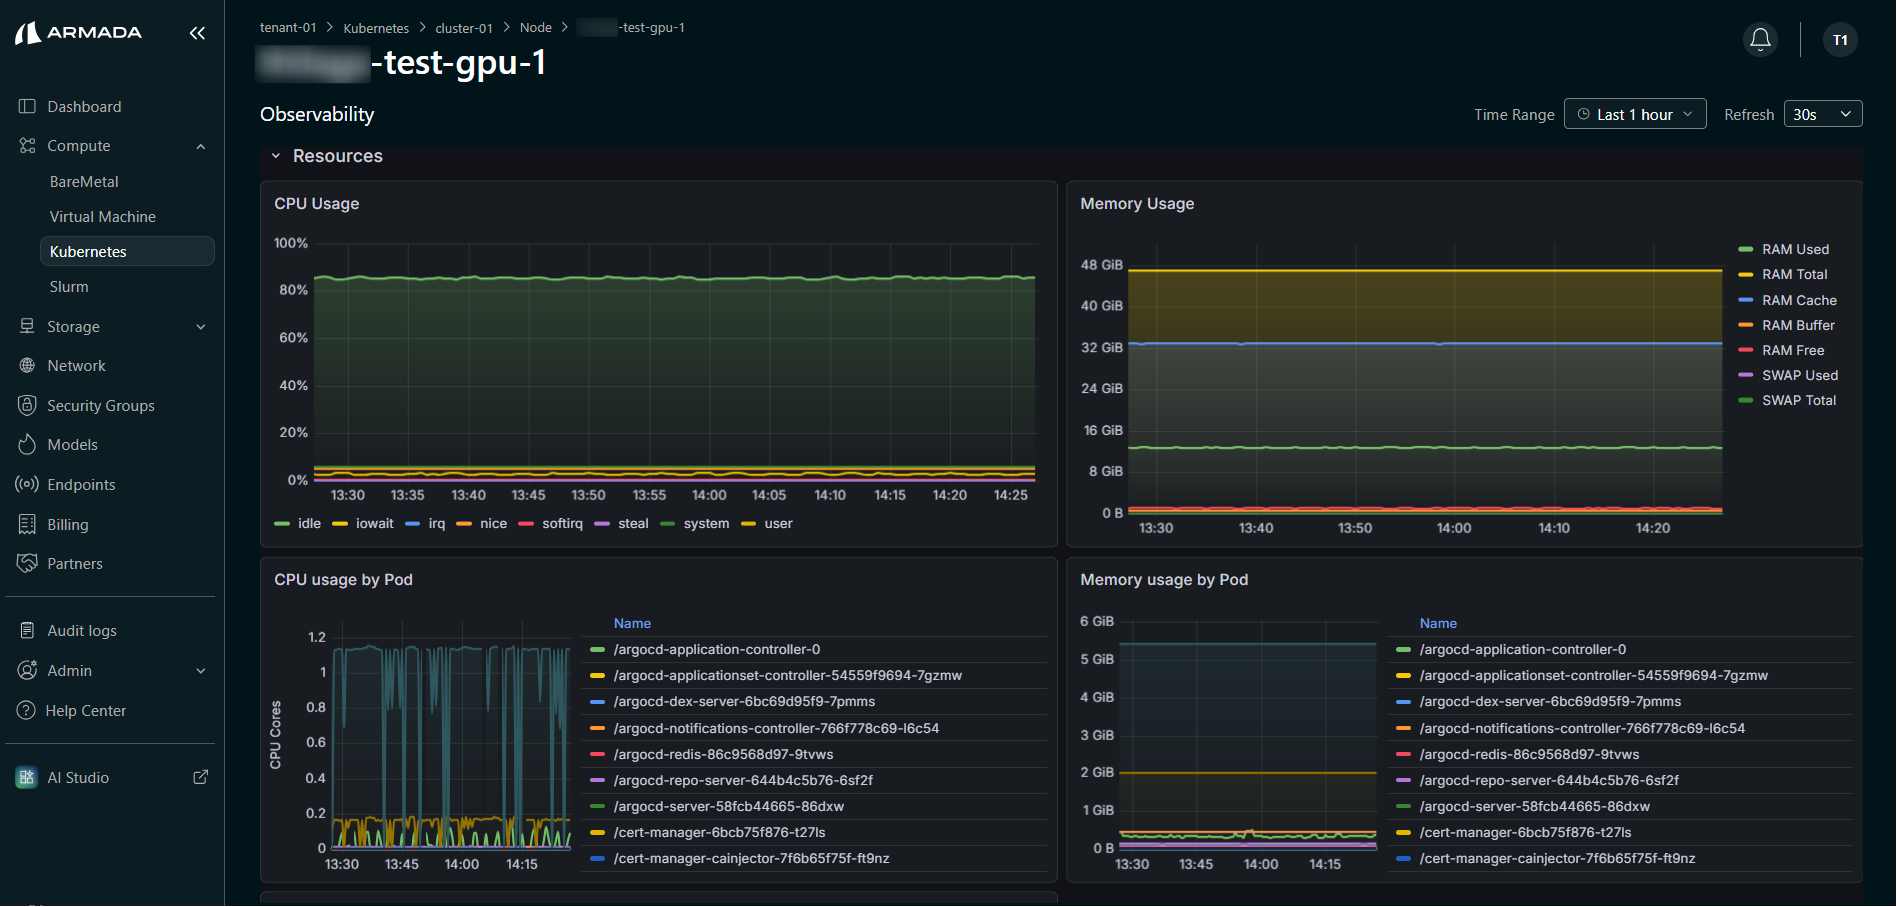
Resources
The Resources panel provides detailed CPU and memory utilization charts for the selected node.
Key metrics include:
| Panel | Description |
|---|---|
| CPU Usage | Time-series chart of CPU usage breakdown (iowait, nice, softirq, steal, system, user) |
| Memory Usage | Time-series chart of memory usage breakdown (RAM Used, RAM Cache, RAM Buffer, SWAP Used, SWAP Cache, SWAP Total) |
| CPU Usage by Pod | CPU core consumption per pod over time |
| Memory Usage by Pod | Memory consumption per pod over time |
| Number of CPU Core Throttled | CPU core throttling events over time |
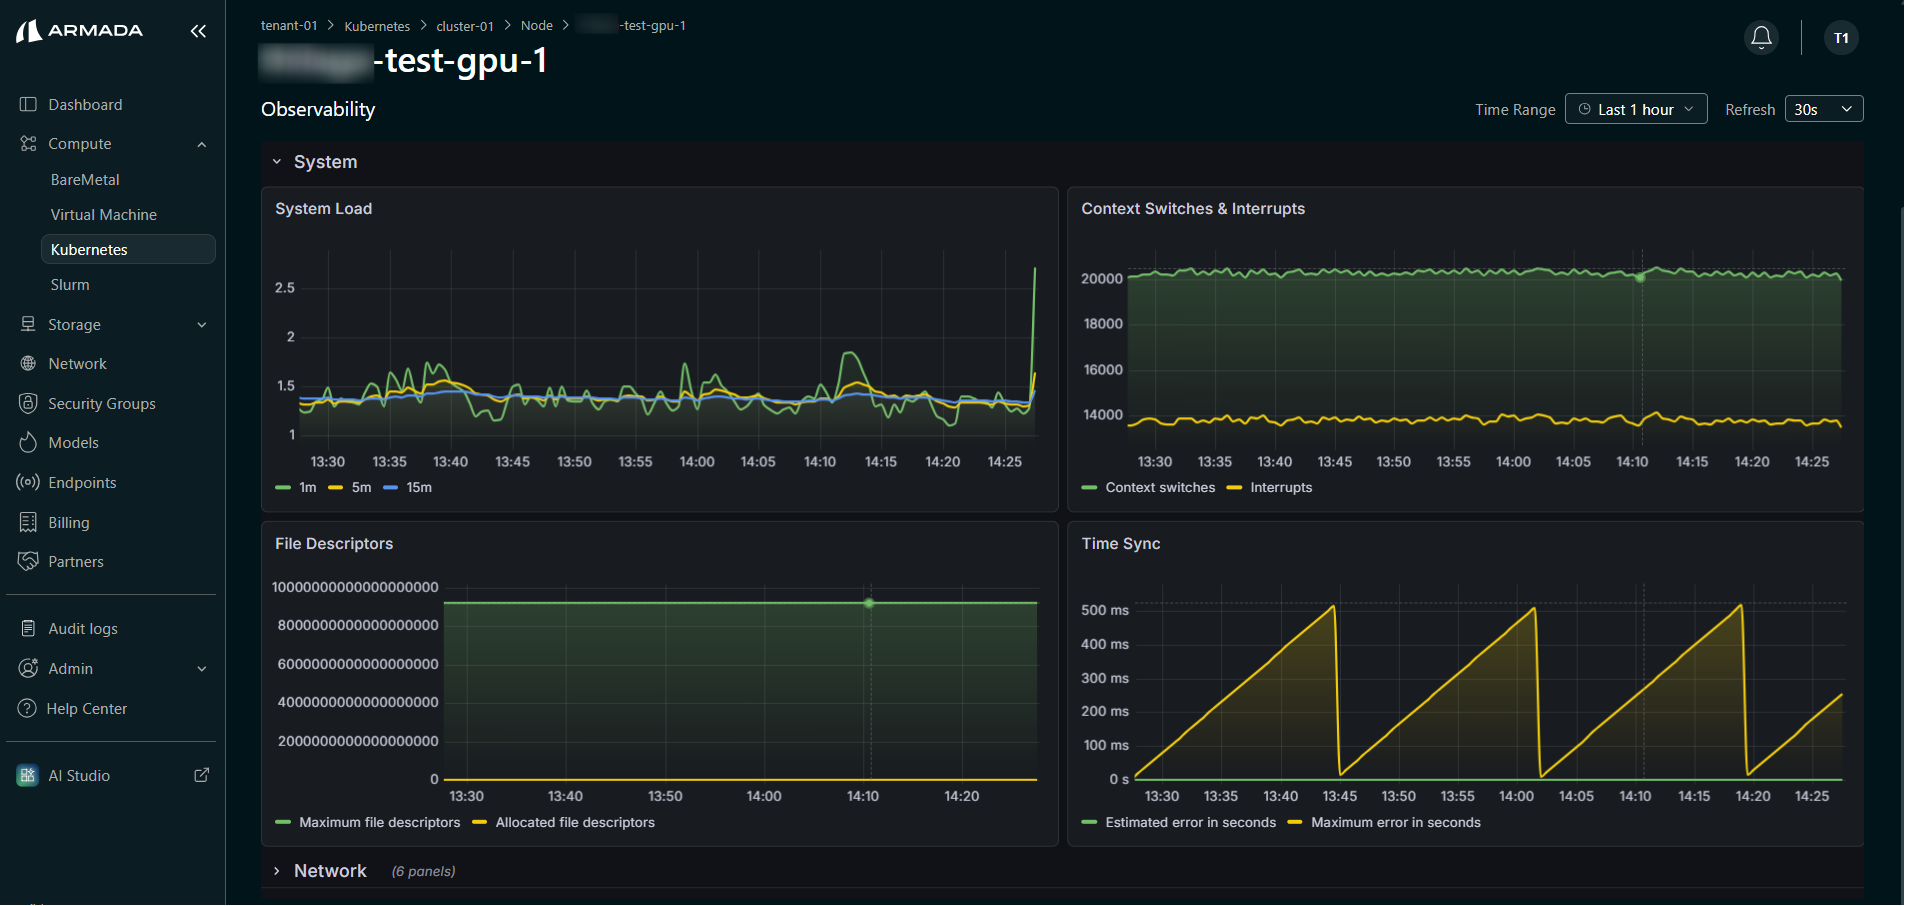
System
The System panel provides operating system-level metrics for the selected node.
Key metrics include:
| Panel | Description |
|---|---|
| System Load | System load averages (1m, 5m, 15m) over time |
| Context Switches & Interrupts | Context switch and interrupt counts over time |
| File Descriptors | Maximum vs. allocated file descriptors over time |
| Time Sync | Estimated time synchronization error in seconds |
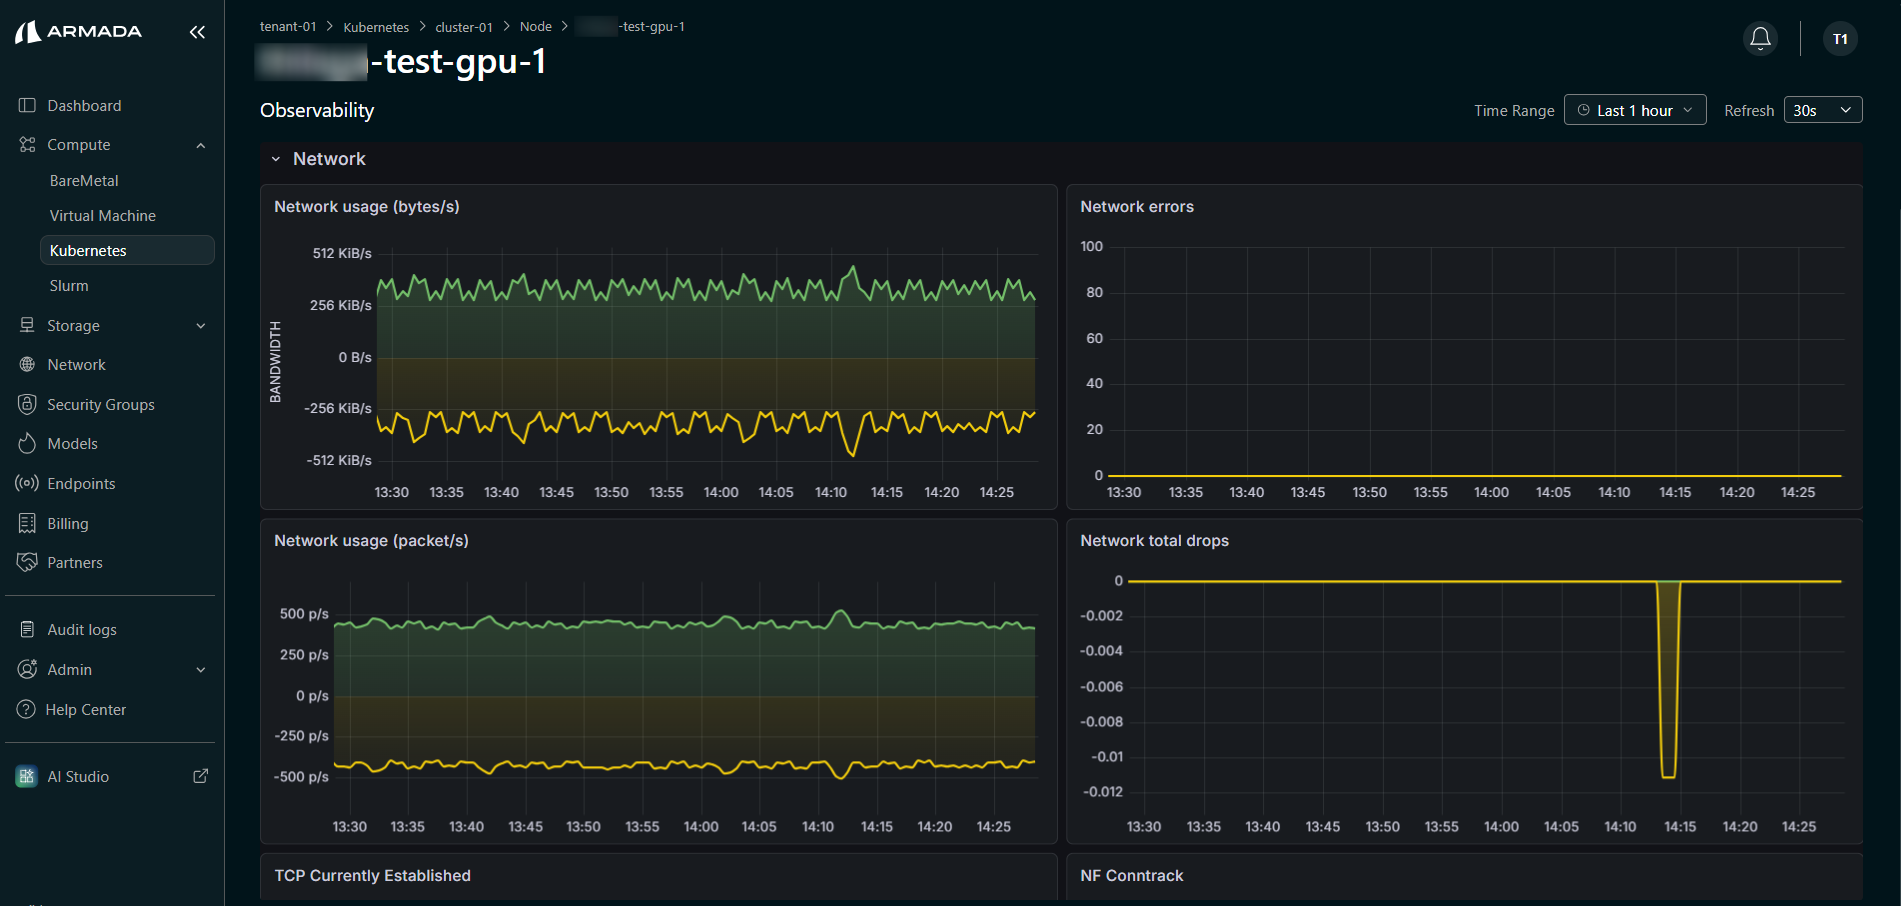
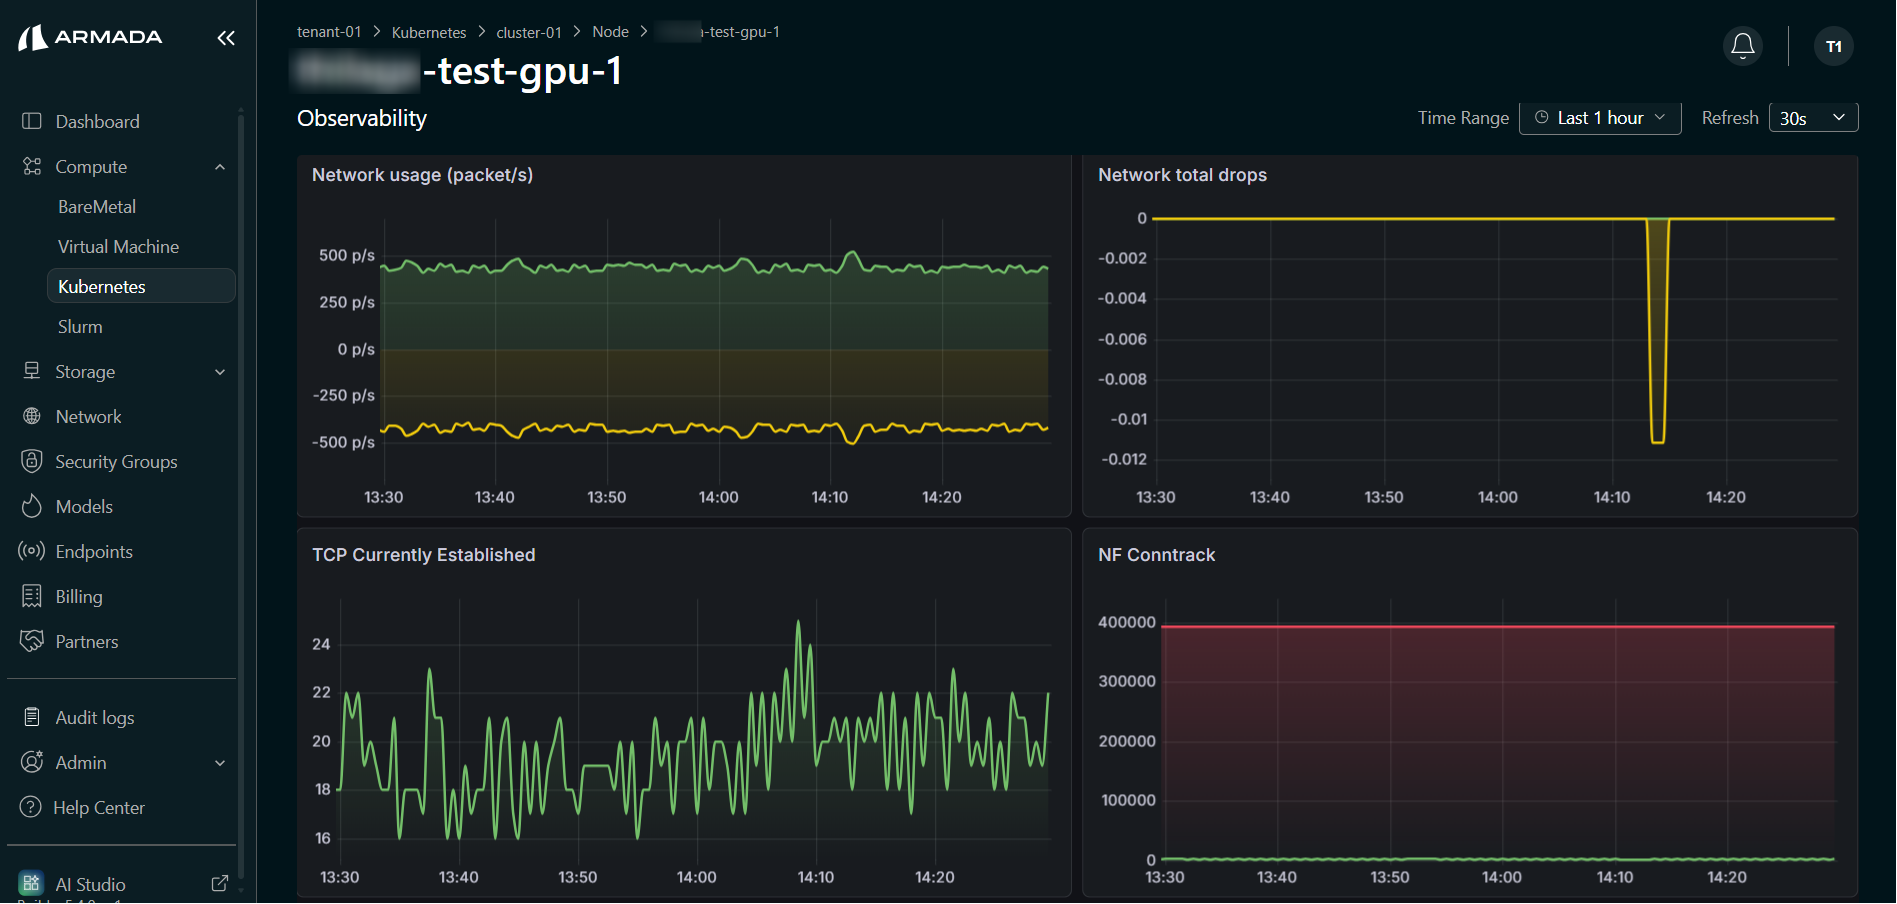
Network
The Network panel provides network traffic and connection metrics for the selected node.
Key metrics include:
| Panel | Description |
|---|---|
| Network Usage (bytes/s) | Network bandwidth (received and transmitted) in bytes per second |
| Network Errors | Network error counts (received and transmitted) over time |
| Network Usage (packets/s) | Packet rate (received and transmitted) over time |
| Network Total Drops | Total dropped packets over time |
| TCP Currently Established | Number of currently established TCP connections |
| NF Conntrack | Netfilter connection tracking table usage |
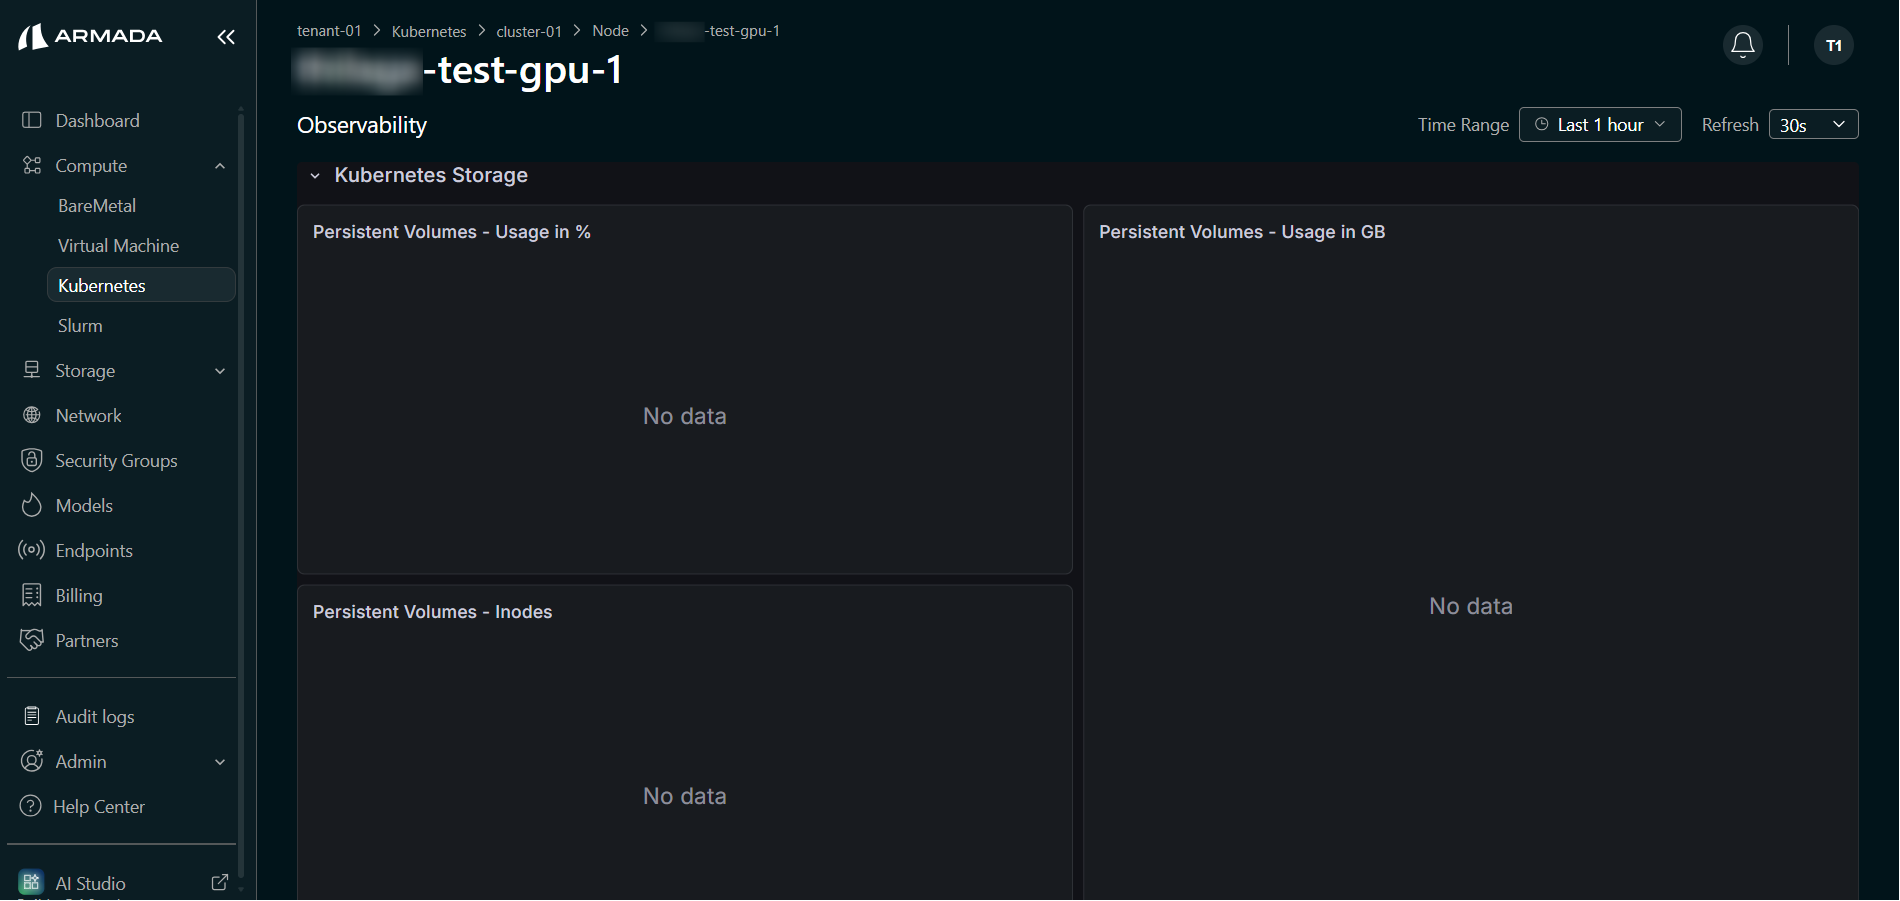
Kubernetes Storage
The Kubernetes Storage panel provides Persistent Volume metrics for the selected node.
Key metrics include:
| Panel | Description |
|---|---|
| Persistent Volumes - Usage in % | Percentage utilization of persistent volumes |
| Persistent Volumes - Usage in GB | Actual storage usage of persistent volumes in GB |
| Persistent Volumes - Inodes | Inode usage for persistent volumes |
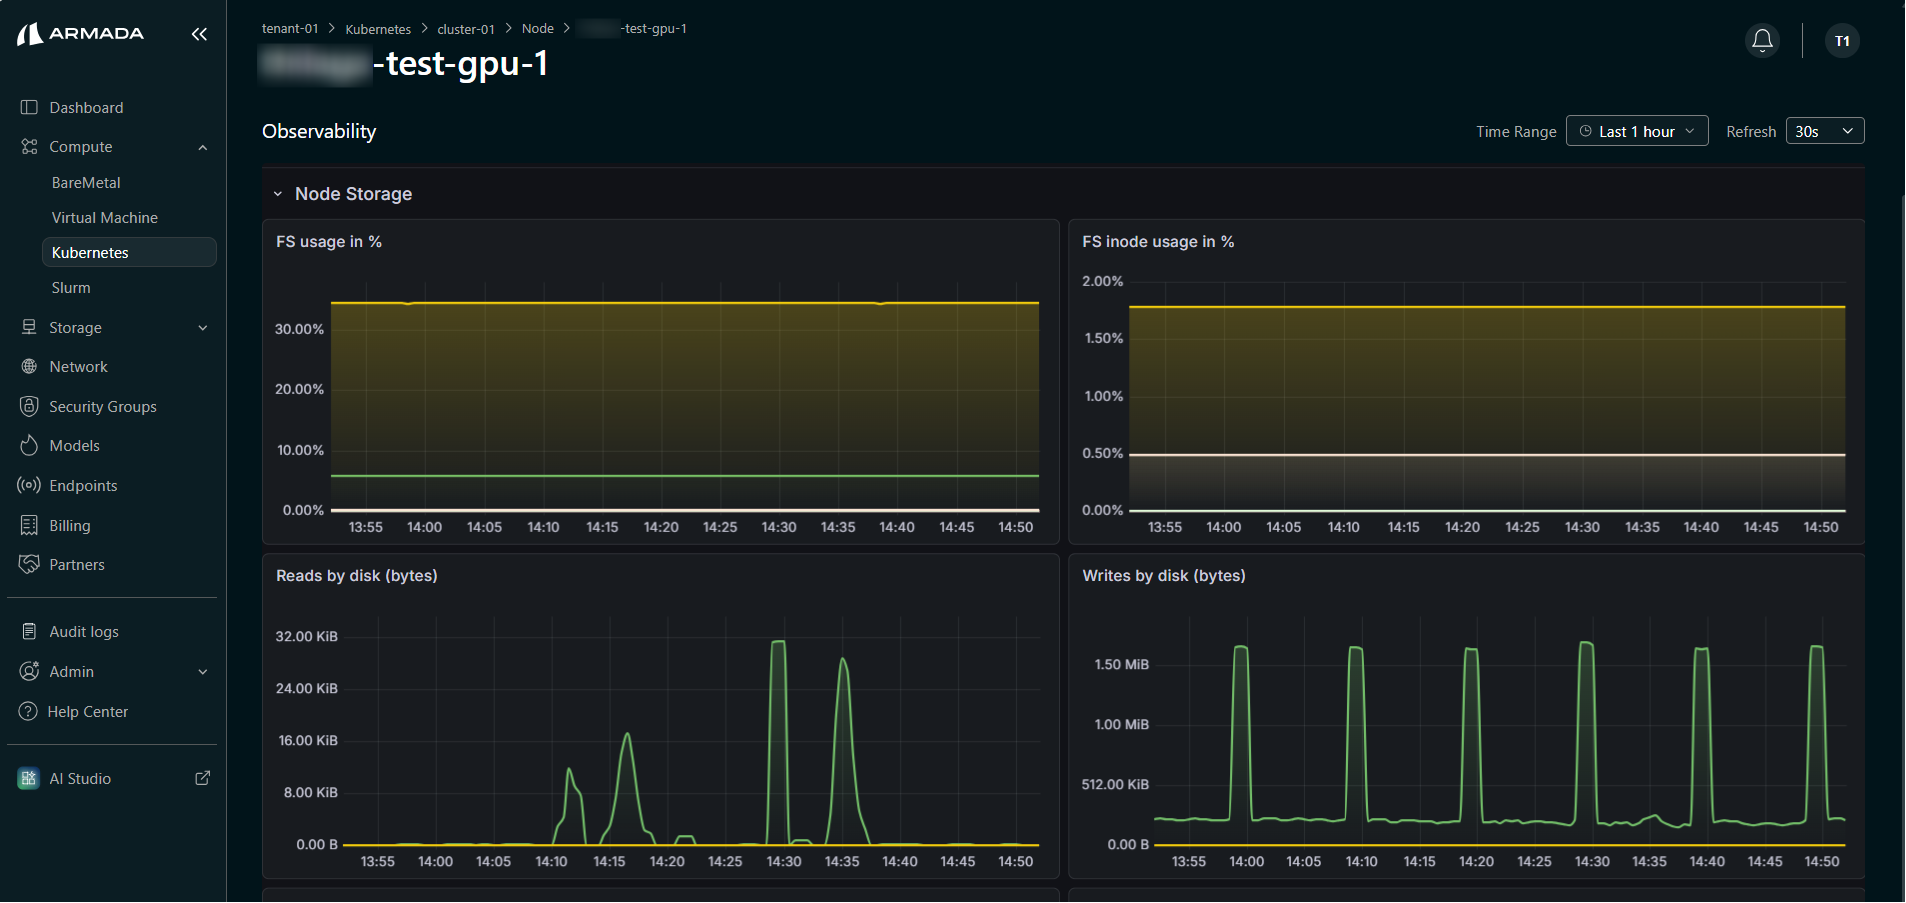
Node Storage
The Node Storage panel provides disk-level metrics for the selected node's local storage.
Key metrics include:
| Panel | Description |
|---|---|
| FS Usage in % | Filesystem usage percentage per mount point over time |
| FS Inode Usage in % | Inode usage percentage per mount point over time |
| Reads by Disk (Bytes) | Disk read throughput in bytes per disk device |
| Writes by Disk (Bytes) | Disk write throughput in bytes per disk device |
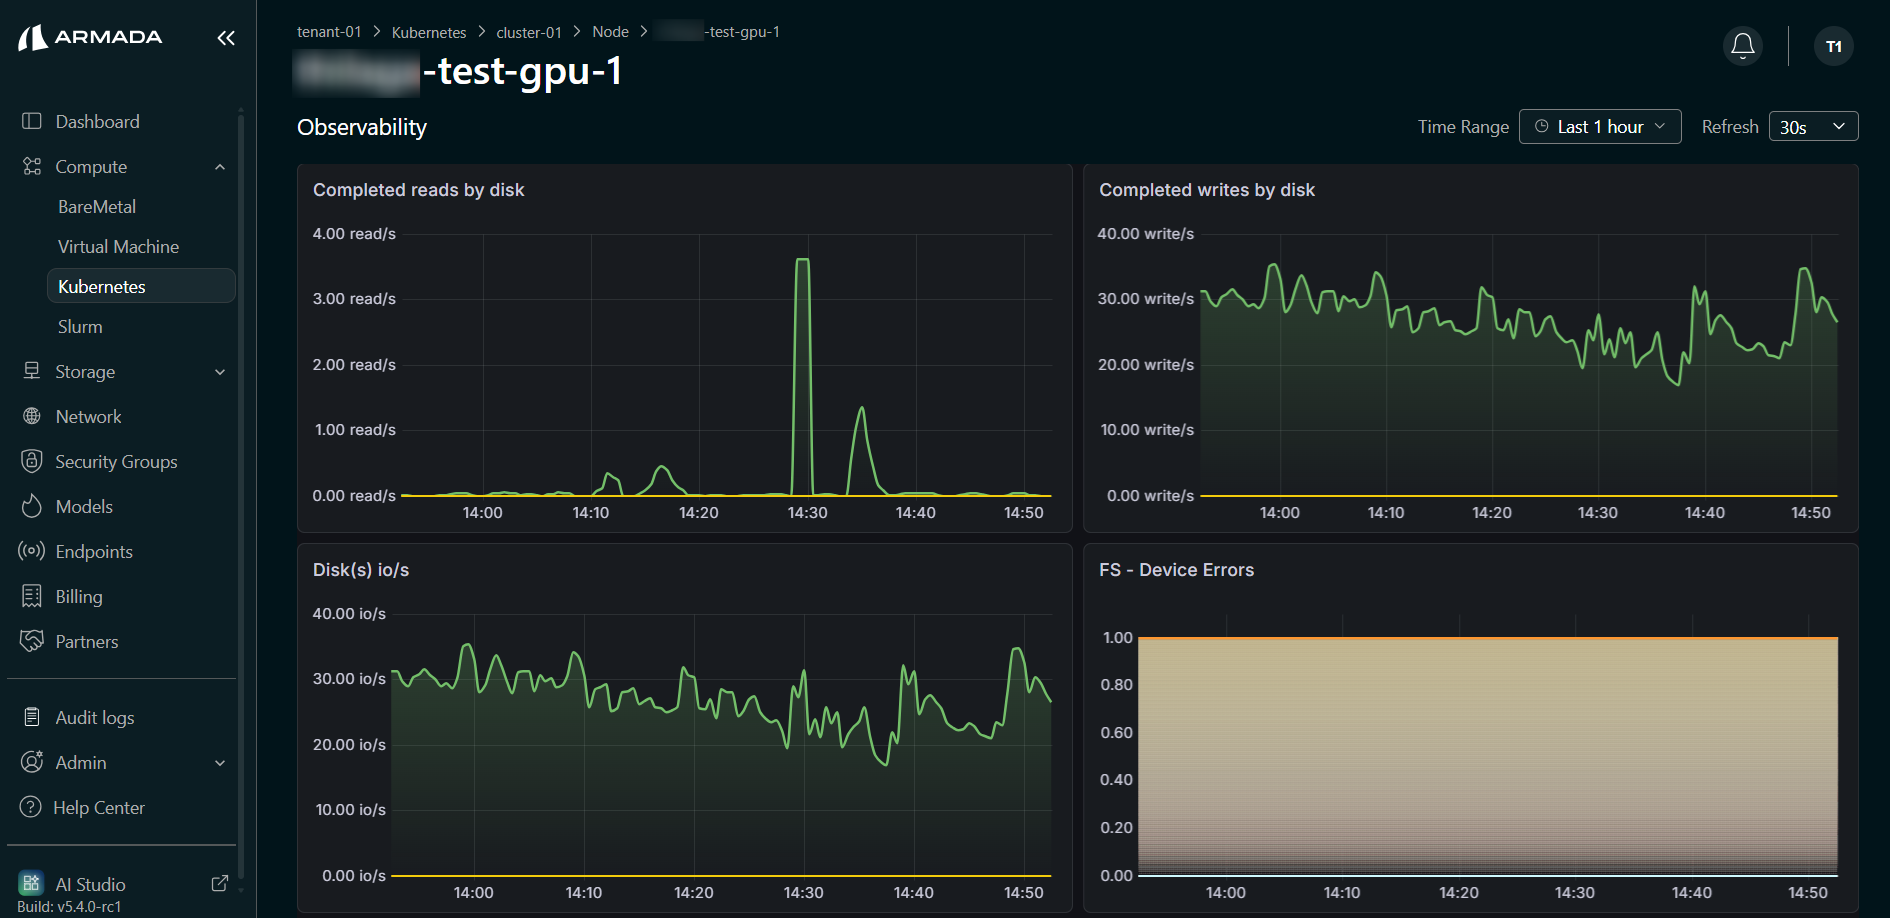
| Completed IOPS by Disk | Completed I/O operations per second per disk |
| Completed Writes by Disk | Completed write operations per second per disk |
| I/O - IOMIX Status | Overall I/O mix status chart |
Next Steps
- Deploy Hugging Face Model — Deploy open-source models from Hugging Face Hub.
- Deploy NIM Model — Deploy GPU-optimized NVIDIA NIM inference containers.
- Deploy Azure ML Model — Deploy models from your Azure ML model registry.
- Application Deployment — Define and deploy custom applications on your Kubernetes cluster.
- NGINX Web Server — Deploy NGINX from the application catalog.